Gold may have over-priced in expectations of a Fed rate hike; be wary of a potential oversold rebound.
2026-07-01 16:22:35
A recent research report from China International Capital Corporation (CICC) points out that current gold prices may have already over-reflected expectations of a Federal Reserve interest rate hike. From an interest rate pricing model perspective, a gold price around $4,000 per ounce already implies a relatively aggressive tightening path, a level significantly higher than the current pricing of future policy paths in the interest rate futures market.

The report argues that continued interest rate hikes by the Federal Reserve are not the core benchmark scenario. The US economy is facing marginal pressures on employment and consumption, while rising financing needs driven by the expansion of the artificial intelligence industry make monetary policy more likely to exhibit a "nominal hawkish, actual dovish" characteristic, meaning that the policy rhetoric is tight but the actual room for contraction is limited.
Against this backdrop, gold's "pre-pricing" of interest rate paths may undergo a temporary correction. If crude oil prices continue to decline and this further impacts short-term US inflation data, market expectations for the duration of high interest rates will be readjusted, and the real interest rate pressure on gold may ease marginally.
However, from the perspective of capital structure and macro environment, gold is still supported by safe-haven demand and global liquidity expectations, and is more likely to show high-level wide-range fluctuations in the medium term rather than a trend reversal.
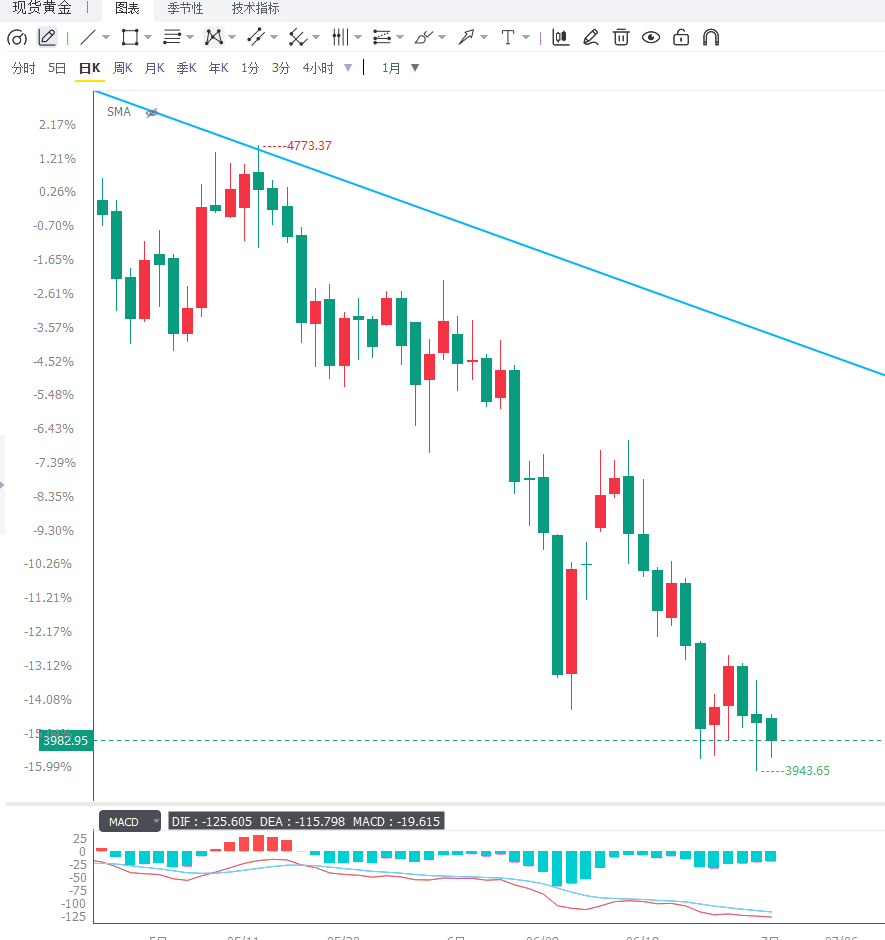
From a daily chart perspective, after a rapid upward move, gold has entered a period of consolidation at high levels, with prices forming a temporary equilibrium around $4,000 per ounce . The overall trend remains within a long-term upward channel, but upward momentum has clearly slowed, exhibiting a structure of "high-level consolidation + momentum convergence."
Resistance is concentrated in the 4050-4080 area, which has repeatedly suppressed further price increases, indicating strong profit-taking pressure at higher levels. Key support lies at 3950 ; a break below this level could trigger a pullback to 3900 or even lower.
From a trend perspective, the MACD momentum on the daily chart is gradually converging, and the red bars are shortening, indicating that the bullish momentum is weakening at the margin. However, no obvious death cross has appeared yet, suggesting that the trend is still in a "high-level oscillation rather than a reversal" phase.
From the 4-hour chart, gold has recently shown a high-level range-bound structure, with prices fluctuating repeatedly within the 3980-4050 range, indicating that the market is in a short-term game driven by data and interest rate expectations.
The short-term moving average system is beginning to flatten, and the price is repeatedly crossing the moving averages, indicating that the forces of bulls and bears are approaching equilibrium. In terms of momentum indicators, the RSI remains in the neutral-to-high range but has not entered the clearly overbought zone, suggesting that there is still room for upward movement, but its sustainability is insufficient.
If the price breaks below the 3980 support level, it may open up room for a short-term pullback to 3950 or even lower; if it regains its footing above 4050 , it may retest the previous high area, but the validity of the breakout needs to be confirmed by positive macroeconomic factors.
Editor's Summary : The current gold market is at a critical stage of "over-pricing of macroeconomic expectations + high-level technical consolidation." CICC emphasizes that the market may have over-indulged in the Fed's interest rate hike path. Once US inflation cools due to declining energy prices, there is room for a correction in interest rate expectations, thus putting temporary pressure on gold. From a technical perspective, the daily chart shows a high-level consolidation phase, while the 4-hour chart shows a range-bound pattern, indicating a balanced struggle between bulls and bears. In the short term, gold is more likely to maintain high-level fluctuations and a repricing process; a clear trend direction needs further confirmation from inflation and interest rate expectations.
The report argues that continued interest rate hikes by the Federal Reserve are not the core benchmark scenario. The US economy is facing marginal pressures on employment and consumption, while rising financing needs driven by the expansion of the artificial intelligence industry make monetary policy more likely to exhibit a "nominal hawkish, actual dovish" characteristic, meaning that the policy rhetoric is tight but the actual room for contraction is limited.
Against this backdrop, gold's "pre-pricing" of interest rate paths may undergo a temporary correction. If crude oil prices continue to decline and this further impacts short-term US inflation data, market expectations for the duration of high interest rates will be readjusted, and the real interest rate pressure on gold may ease marginally.
However, from the perspective of capital structure and macro environment, gold is still supported by safe-haven demand and global liquidity expectations, and is more likely to show high-level wide-range fluctuations in the medium term rather than a trend reversal.
From a daily chart perspective, after a rapid upward move, gold has entered a period of consolidation at high levels, with prices forming a temporary equilibrium around $4,000 per ounce . The overall trend remains within a long-term upward channel, but upward momentum has clearly slowed, exhibiting a structure of "high-level consolidation + momentum convergence."
Resistance is concentrated in the 4050-4080 area, which has repeatedly suppressed further price increases, indicating strong profit-taking pressure at higher levels. Key support lies at 3950 ; a break below this level could trigger a pullback to 3900 or even lower.
From a trend perspective, the MACD momentum on the daily chart is gradually converging, and the red bars are shortening, indicating that the bullish momentum is weakening at the margin. However, no obvious death cross has appeared yet, suggesting that the trend is still in a "high-level oscillation rather than a reversal" phase.
From the 4-hour chart, gold has recently shown a high-level range-bound structure, with prices fluctuating repeatedly within the 3980-4050 range, indicating that the market is in a short-term game driven by data and interest rate expectations.
The short-term moving average system is beginning to flatten, and the price is repeatedly crossing the moving averages, indicating that the forces of bulls and bears are approaching equilibrium. In terms of momentum indicators, the RSI remains in the neutral-to-high range but has not entered the clearly overbought zone, suggesting that there is still room for upward movement, but its sustainability is insufficient.
If the price breaks below the 3980 support level, it may open up room for a short-term pullback to 3950 or even lower; if it regains its footing above 4050 , it may retest the previous high area, but the validity of the breakout needs to be confirmed by positive macroeconomic factors.
Editor's Summary : The current gold market is at a critical stage of "over-pricing of macroeconomic expectations + high-level technical consolidation." CICC emphasizes that the market may have over-indulged in the Fed's interest rate hike path. Once US inflation cools due to declining energy prices, there is room for a correction in interest rate expectations, thus putting temporary pressure on gold. From a technical perspective, the daily chart shows a high-level consolidation phase, while the 4-hour chart shows a range-bound pattern, indicating a balanced struggle between bulls and bears. In the short term, gold is more likely to maintain high-level fluctuations and a repricing process; a clear trend direction needs further confirmation from inflation and interest rate expectations.
- Risk Warning and Disclaimer
- The market involves risk, and trading may not be suitable for all investors. This article is for reference only and does not constitute personal investment advice, nor does it take into account certain users’ specific investment objectives, financial situation, or other needs. Any investment decisions made based on this information are at your own risk.