Gold Analysis: Renewed geopolitical tensions in the Middle East cause international gold prices to fall.
2026-07-09 03:03:56
Gold prices have been under significant pressure recently. Over the past two trading days, spot gold against the US dollar (XAU/USD) has weakened again, with a cumulative decline of over 3%. Even with renewed escalation of geopolitical conflicts in the Middle East, the sell-off in gold has not stopped, while bonds and the US dollar have become increasingly attractive alternatives to gold as a safe-haven asset. If this market logic continues to unfold, gold prices may face continued downward pressure in the coming trading days.

The situation in the Middle East has once again become the focus of market risk.
Previously, Middle Eastern parties had hoped to reach a temporary ceasefire agreement to clear the shipping lanes in the Strait of Hormuz. However, the recent attacks on three commercial vessels prompted the United States to launch a new round of military strikes against Iran and revoke its license for global open sales of Iranian crude oil.
Geopolitical tensions continue to escalate, and Trump has publicly stated that the ceasefire between the US and Iran has ended, significantly reducing the likelihood of the two sides reaching formal negotiations.
Market risk premiums rose in tandem, with WTI crude oil surging nearly 10% in the past two trading days. Market concerns have resurfaced about a rebound in inflationary pressures in 2026, with central banks potentially intensifying tightening measures to suppress inflation. However, this fundamental shift has not been favorable for gold.
Gold has always been regarded as a top safe-haven asset, but in recent months, as conflicts in the Middle East have escalated, funds have favored alternative safe-haven assets such as bonds and the US dollar.
Looking at the US Treasury market, the 10-year US Treasury yield rose again, approaching the 4.6% mark; the short-term US Treasury yield curve has steepened, and compared with gold, bonds have become significantly more attractive to funds, with funds flowing into the bond market first amid escalating geopolitical conflicts.
The increased attractiveness of the bond market further boosted demand for the US dollar. On the one hand, international capital flowed into the US Treasury market in large quantities; on the other hand, escalating conflicts in the Middle East spurred global demand for safe-haven liquidity, and the US dollar has always been the mainstream safe-haven currency during geopolitical crises.
The US Dollar Index (DXY) directly reflects the strength of capital inflows, measuring the dollar's exchange rate against a basket of major currencies. The escalation of the current conflict, coupled with support from high US Treasury yields, has allowed the DXY to stabilize near the 101 level, indicating strong demand for the dollar.
The two factors mentioned above are exerting double pressure on gold: rising US Treasury yields and a stronger dollar, making it difficult for gold prices to rebound. Currently, the market views the dollar as a safe-haven asset with superior liquidity compared to gold, and bonds generate interest income while gold offers no interest-bearing value.
Funds continue to flow out of gold and into the aforementioned alternative assets. If the Middle East conflict continues to increase the allocation value of the bond market and the US dollar, the upside potential for gold prices in the short term will be extremely limited, and XAU/USD may continue to face selling pressure.
Gold Technical Analysis
The downtrend line continues to exert downward pressure: Although gold prices saw a brief rebound in recent weeks, the long-term downtrend line on the daily chart remains the core technical pattern dominating gold prices for months. There are currently no strong bullish signals on the chart, and this bearish structure remains the primary indicator to watch. If short-term selling pressure persists, gold prices are highly likely to continue declining along this downtrend line in the coming weeks.
Relative Strength Index (RSI): The RSI indicator is trading below the 50 neutral line and maintaining a downward trend, indicating strong selling pressure in the market over the past 14 trading days. If the indicator continues its current pattern, the short-term downward trend in gold prices is unlikely to reverse.
TRIX Triple Exponential Moving Average: The TRIX indicator is continuously declining below the zero axis, indicating that the long-term exponential moving average maintains an overall bearish pattern. Judging from the medium- to long-term market perspective, bearish forces will continue to dominate the market.
Key level
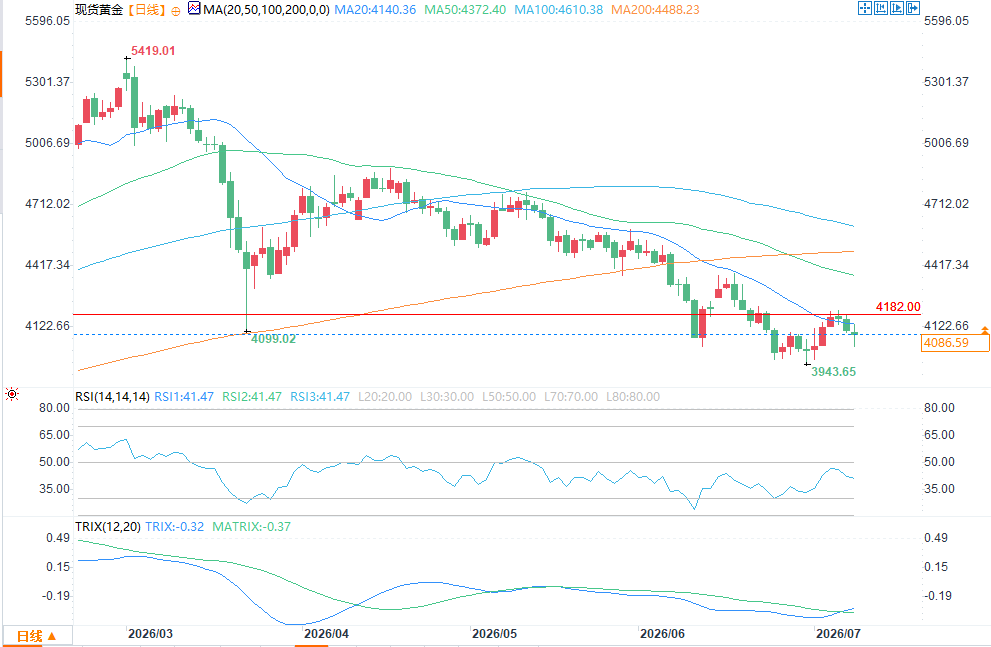
$4345 – Key Resistance Level
This price level represents a significant previous high, forming a confluence of resistance with the long-term downtrend line and the 50-period simple moving average. If gold prices rebound to this level and break through, the existing downtrend line will risk becoming invalid, and the market is expected to shift to a clear bullish trend in the coming weeks.
$4182 – Short-term support/resistance level
This range represents a recent equilibrium between bulls and bears, and also coincides with several key pullback levels in recent weeks. If gold prices continue to fluctuate around this level, market sentiment will remain cautious, and a short-term sideways consolidation is highly probable.
$3886 - Key Support Level
This level corresponds to the low point in October 2025 and is the primary target for short positions. Once gold prices decline towards this support area, the bears will regain absolute dominance, and the downtrend line will continue to dominate the overall market trend for the next few weeks.
The situation in the Middle East has once again become the focus of market risk.
Previously, Middle Eastern parties had hoped to reach a temporary ceasefire agreement to clear the shipping lanes in the Strait of Hormuz. However, the recent attacks on three commercial vessels prompted the United States to launch a new round of military strikes against Iran and revoke its license for global open sales of Iranian crude oil.
Geopolitical tensions continue to escalate, and Trump has publicly stated that the ceasefire between the US and Iran has ended, significantly reducing the likelihood of the two sides reaching formal negotiations.
Market risk premiums rose in tandem, with WTI crude oil surging nearly 10% in the past two trading days. Market concerns have resurfaced about a rebound in inflationary pressures in 2026, with central banks potentially intensifying tightening measures to suppress inflation. However, this fundamental shift has not been favorable for gold.
Gold has always been regarded as a top safe-haven asset, but in recent months, as conflicts in the Middle East have escalated, funds have favored alternative safe-haven assets such as bonds and the US dollar.
Looking at the US Treasury market, the 10-year US Treasury yield rose again, approaching the 4.6% mark; the short-term US Treasury yield curve has steepened, and compared with gold, bonds have become significantly more attractive to funds, with funds flowing into the bond market first amid escalating geopolitical conflicts.
The increased attractiveness of the bond market further boosted demand for the US dollar. On the one hand, international capital flowed into the US Treasury market in large quantities; on the other hand, escalating conflicts in the Middle East spurred global demand for safe-haven liquidity, and the US dollar has always been the mainstream safe-haven currency during geopolitical crises.
The US Dollar Index (DXY) directly reflects the strength of capital inflows, measuring the dollar's exchange rate against a basket of major currencies. The escalation of the current conflict, coupled with support from high US Treasury yields, has allowed the DXY to stabilize near the 101 level, indicating strong demand for the dollar.
The two factors mentioned above are exerting double pressure on gold: rising US Treasury yields and a stronger dollar, making it difficult for gold prices to rebound. Currently, the market views the dollar as a safe-haven asset with superior liquidity compared to gold, and bonds generate interest income while gold offers no interest-bearing value.
Funds continue to flow out of gold and into the aforementioned alternative assets. If the Middle East conflict continues to increase the allocation value of the bond market and the US dollar, the upside potential for gold prices in the short term will be extremely limited, and XAU/USD may continue to face selling pressure.
Gold Technical Analysis
The downtrend line continues to exert downward pressure: Although gold prices saw a brief rebound in recent weeks, the long-term downtrend line on the daily chart remains the core technical pattern dominating gold prices for months. There are currently no strong bullish signals on the chart, and this bearish structure remains the primary indicator to watch. If short-term selling pressure persists, gold prices are highly likely to continue declining along this downtrend line in the coming weeks.
Relative Strength Index (RSI): The RSI indicator is trading below the 50 neutral line and maintaining a downward trend, indicating strong selling pressure in the market over the past 14 trading days. If the indicator continues its current pattern, the short-term downward trend in gold prices is unlikely to reverse.
TRIX Triple Exponential Moving Average: The TRIX indicator is continuously declining below the zero axis, indicating that the long-term exponential moving average maintains an overall bearish pattern. Judging from the medium- to long-term market perspective, bearish forces will continue to dominate the market.
Key level
$4345 – Key Resistance Level
This price level represents a significant previous high, forming a confluence of resistance with the long-term downtrend line and the 50-period simple moving average. If gold prices rebound to this level and break through, the existing downtrend line will risk becoming invalid, and the market is expected to shift to a clear bullish trend in the coming weeks.
$4182 – Short-term support/resistance level
This range represents a recent equilibrium between bulls and bears, and also coincides with several key pullback levels in recent weeks. If gold prices continue to fluctuate around this level, market sentiment will remain cautious, and a short-term sideways consolidation is highly probable.
$3886 - Key Support Level
This level corresponds to the low point in October 2025 and is the primary target for short positions. Once gold prices decline towards this support area, the bears will regain absolute dominance, and the downtrend line will continue to dominate the overall market trend for the next few weeks.
- Risk Warning and Disclaimer
- The market involves risk, and trading may not be suitable for all investors. This article is for reference only and does not constitute personal investment advice, nor does it take into account certain users’ specific investment objectives, financial situation, or other needs. Any investment decisions made based on this information are at your own risk.