













The specter of inflation is making a comeback! The Federal Reserve is forced to "show its hawkish claws," gold is crawling below the 200-day moving average, and an even bigger crisis lies ahead?
2026-07-09 14:17:52
On Thursday (July 9) during the Asian session, spot gold prices entered a consolidation phase after rebounding from the $4,020 per ounce area (a one-week low) the previous day, and are currently trading around $4,090 per ounce.
The dollar was on the defensive in the absence of clear hawkish signals in the Fed minutes, which should have provided support for gold.
However, the continued escalation of the US-Iran conflict has reignited inflation concerns and solidified market expectations for a Federal Reserve rate hike in 2026. This has limited the dollar's decline to some extent, while continuing to put pressure on non-interest-bearing gold.
The gold market is currently in a delicate balance between bullish and bearish forces. On the bullish side, the US dollar index failed to receive any new hawkish catalysts after the release of the FOMC minutes and remained on the defensive, which provided traditional support for gold priced in US dollars.
The minutes revealed internal divisions within the policymaking body regarding the direction of interest rates—many participants believed that interest rates might be at or slightly below current levels by the end of the year—which undermined the narrative of a one-sided strengthening of the dollar.
However, negative factors cannot be ignored. The minutes also explicitly stated that upside risks to inflation remain high, noting that "some policy tightening may be needed to bring inflation back to 2%." This statement reinforced market expectations that the Federal Reserve will maintain its tightening stance. The CME Group's FedWatch tool shows that traders are currently pricing in a roughly 70% probability of a September rate hike.
More crucially, geopolitical factors played a significant role. The US launched a new round of strikes against Iran on Wednesday in retaliation for Iranian attacks on commercial vessels in the Strait of Hormuz. Iran, in turn, continued its retaliatory strikes against US military targets in Bahrain and Kuwait. On the same day, Trump announced that the US-Iran ceasefire agreement was "now over." This escalation reignited concerns about energy-driven inflation, further solidifying expectations of a Federal Reserve rate hike, thus suppressing upward momentum in gold prices.
In addition, the number of initial jobless claims in the United States last week will be released later today, and speeches by voting members of the FOMC will also provide the market with additional policy clues. However, the market's core focus will remain on the development of the situation in the Middle East.
From a technical perspective, gold maintains its recent bearish tone on the daily chart. The price is trading below the 200-day simple moving average and within a descending parallel channel—both technical characteristics point to a bearish structure.
In terms of indicators, the MACD is below the zero line, the DIFF line at -75.21 has crossed the DEA line at -92.55 to form a golden cross, the red bars are increasing in volume, and the bearish momentum has clearly weakened; the RSI has rebounded from the oversold zone, with the RSI1 around 46.00, which has not yet reached the 70 overbought zone, and there is still room for short-term recovery.
Further up, the 200-day simple moving average ($4489.53/oz) forms an even stronger defensive line. This means that even if gold prices manage to break through the descending channel, their upside potential will still be limited by the moving average resistance.
On the downside, initial support is seen around the overnight low of 4020 and the psychological level of 4000, with further support around the recent low of 3943. The medium-term target is around the lower edge of the descending channel at approximately $3812 per ounce. If the current corrective decline continues, this level will be a key area where bulls may defend the broader uptrend.
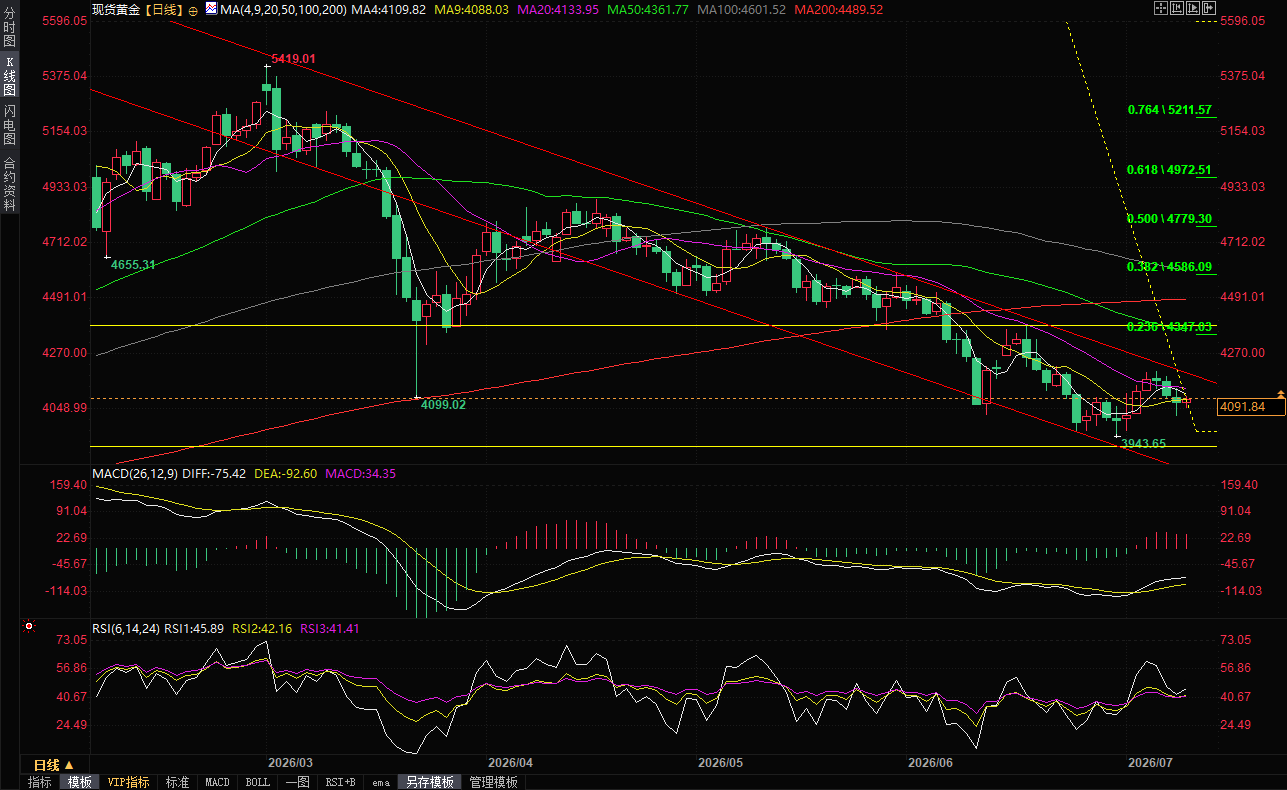
(Spot gold daily chart, source: FX678)
In summary, gold is currently in a "support below, resistance above" pattern. The weakness of the US dollar provides bottom support for gold prices, but inflation concerns stemming from the US-Iran conflict and expectations of a Fed rate hike limit upside potential. Technically, the bearish structure below the 200-day moving average and the complete formation of a descending channel suggest that any attempt at a rebound is likely to encounter selling pressure.
In the short term, gold prices may remain range-bound around current levels, awaiting a new catalyst to break the equilibrium.
At 14:15 Beijing time on July 9, spot gold was trading at $4094.95 per ounce.
The dollar was on the defensive in the absence of clear hawkish signals in the Fed minutes, which should have provided support for gold.
However, the continued escalation of the US-Iran conflict has reignited inflation concerns and solidified market expectations for a Federal Reserve rate hike in 2026. This has limited the dollar's decline to some extent, while continuing to put pressure on non-interest-bearing gold.
Fundamentals: With bullish and bearish factors intertwined, gold faces a directional decision.
The gold market is currently in a delicate balance between bullish and bearish forces. On the bullish side, the US dollar index failed to receive any new hawkish catalysts after the release of the FOMC minutes and remained on the defensive, which provided traditional support for gold priced in US dollars.
The minutes revealed internal divisions within the policymaking body regarding the direction of interest rates—many participants believed that interest rates might be at or slightly below current levels by the end of the year—which undermined the narrative of a one-sided strengthening of the dollar.
However, negative factors cannot be ignored. The minutes also explicitly stated that upside risks to inflation remain high, noting that "some policy tightening may be needed to bring inflation back to 2%." This statement reinforced market expectations that the Federal Reserve will maintain its tightening stance. The CME Group's FedWatch tool shows that traders are currently pricing in a roughly 70% probability of a September rate hike.
More crucially, geopolitical factors played a significant role. The US launched a new round of strikes against Iran on Wednesday in retaliation for Iranian attacks on commercial vessels in the Strait of Hormuz. Iran, in turn, continued its retaliatory strikes against US military targets in Bahrain and Kuwait. On the same day, Trump announced that the US-Iran ceasefire agreement was "now over." This escalation reignited concerns about energy-driven inflation, further solidifying expectations of a Federal Reserve rate hike, thus suppressing upward momentum in gold prices.
In addition, the number of initial jobless claims in the United States last week will be released later today, and speeches by voting members of the FOMC will also provide the market with additional policy clues. However, the market's core focus will remain on the development of the situation in the Middle East.
Technical Analysis
From a technical perspective, gold maintains its recent bearish tone on the daily chart. The price is trading below the 200-day simple moving average and within a descending parallel channel—both technical characteristics point to a bearish structure.
In terms of indicators, the MACD is below the zero line, the DIFF line at -75.21 has crossed the DEA line at -92.55 to form a golden cross, the red bars are increasing in volume, and the bearish momentum has clearly weakened; the RSI has rebounded from the oversold zone, with the RSI1 around 46.00, which has not yet reached the 70 overbought zone, and there is still room for short-term recovery.
Further up, the 200-day simple moving average ($4489.53/oz) forms an even stronger defensive line. This means that even if gold prices manage to break through the descending channel, their upside potential will still be limited by the moving average resistance.
On the downside, initial support is seen around the overnight low of 4020 and the psychological level of 4000, with further support around the recent low of 3943. The medium-term target is around the lower edge of the descending channel at approximately $3812 per ounce. If the current corrective decline continues, this level will be a key area where bulls may defend the broader uptrend.
(Spot gold daily chart, source: FX678)
Outlook: Gold price rebound may face selling pressure, awaiting new catalysts.
In summary, gold is currently in a "support below, resistance above" pattern. The weakness of the US dollar provides bottom support for gold prices, but inflation concerns stemming from the US-Iran conflict and expectations of a Fed rate hike limit upside potential. Technically, the bearish structure below the 200-day moving average and the complete formation of a descending channel suggest that any attempt at a rebound is likely to encounter selling pressure.
In the short term, gold prices may remain range-bound around current levels, awaiting a new catalyst to break the equilibrium.
At 14:15 Beijing time on July 9, spot gold was trading at $4094.95 per ounce.
- Risk Warning and Disclaimer
- The market involves risk, and trading may not be suitable for all investors. This article is for reference only and does not constitute personal investment advice, nor does it take into account certain users’ specific investment objectives, financial situation, or other needs. Any investment decisions made based on this information are at your own risk.

