Gold prices rose due to bargain hunting and internal disagreements within the Federal Reserve, but the upside potential is likely to be limited.
2026-07-09 19:16:33
On Thursday (July 9), during the European trading session, international gold prices saw a mild rebound, with many investors bullish on medium- to long-term gold prices entering the market to position themselves, ending the previous three-day downward trend. Many investors believe that this round of decline excessively released short-selling pressure, and that gold prices have now reached a range with investment value. This is the core short-term driving factor behind the stabilization and rebound of gold prices.

Following the release of the minutes from the Federal Reserve's June policy meeting, the US dollar index retreated slightly. The minutes revealed a hawkish bias that was less pronounced than some market participants had anticipated. However, geopolitical risks remain significant. The escalating tensions between the US and Iran continue to support high international oil prices, fueling global concerns about persistently high inflation. Since gold itself does not generate interest income, and the high inflation environment will force the Federal Reserve to maintain a relatively tight policy stance, this significantly limits the upside potential of precious metal prices.
The meeting minutes revealed significant internal divisions within the Federal Reserve, with policymakers holding roughly equal views on whether to continue raising interest rates. Nine officials anticipated at least one more rate hike before the end of the year, while the remaining nine advocated maintaining the current interest rate level. This split within the Fed made it difficult for the market to predict the overall direction of the policy, leaving investors uncertain whether monetary policy would lean towards easing or tightening, leading to fluctuating risk aversion in the market.
Although the minutes did not substantially reinforce the argument for continued interest rate hikes, they also released almost no positive signals for interest rate cuts, completely shattering the market's optimistic illusions of a rapid interest rate cut cycle within the year. Market participants can only focus their subsequent judgments entirely on the various US economic indicators that will be released one after another, waiting for the data to provide clear guidance.
Currently, the market is betting on a roughly 65% probability of a Fed rate hike in September. Meanwhile, renewed geopolitical conflicts in the Middle East will continue to push up energy prices, further increasing uncertainty about inflation trends and adding challenges to the Fed's policy-making. If oil prices continue to surge, it will be difficult for US CPI data to fall back to the 2% target range, forcing the Fed to maintain its hawkish stance, which is a long-term negative factor for gold.
Considering the above factors, it is unlikely that real yields and the US dollar index will decline significantly in the short term. The strong dollar trend is unlikely to reverse in the short term, and gold's competitive disadvantage compared to interest-bearing assets will continue. This makes it difficult for gold prices to start a long and strong rebound, and the overall rebound will be significantly compressed.
The market's focus will now shift to the weekly initial jobless claims data in the US and public speeches by several Federal Reserve officials. These employment figures reflect the state of the US labor market, while officials' statements reveal their latest views on interest rate hikes and inflation, providing crucial clues for the future of monetary policy. In addition, the evolving situation in the Middle East is also closely watched by investors; if oil prices rise again, market anxiety about inflation will intensify, thereby suppressing the upward momentum of gold.
Technical Analysis
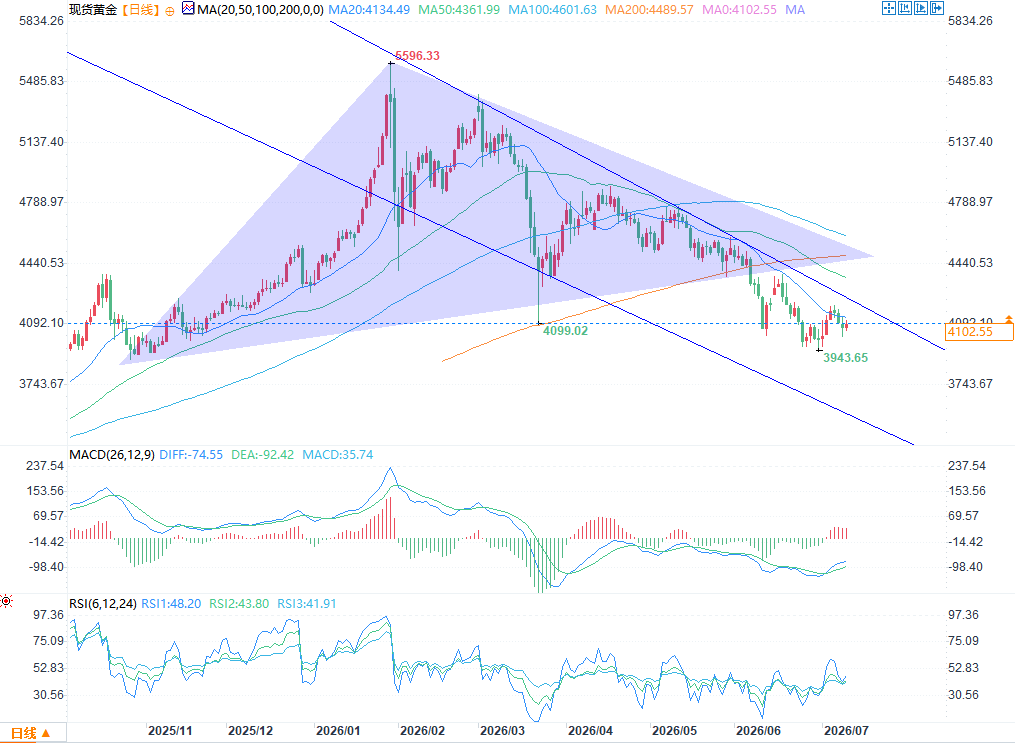
(Spot gold daily chart source: FX678)
After breaking below the symmetrical triangle pattern and the 200-day moving average, gold prices fell all the way to a low of around 3940, the lowest level since October last year. The successive breaches of previous bullish support levels triggered a large number of programmed stop-loss orders, exacerbating the previous downward trend in gold prices.
Although gold prices have temporarily stabilized, they remain below the downtrend line and the 50-day and 200-day moving averages, indicating a continued bearish medium- to long-term technical outlook. The moving average system has formed a downward-sloping resistance pattern, and the medium-term downtrend has not been reversed by this short-term rebound.
Short sellers will wait for gold prices to break below the key level of 3940, creating a new low for the current phase. At that point, gold prices will likely test the strong support level of 3800. If the 3940 support level is breached, bearish sentiment will intensify again, opening up significant downside potential.
If gold prices are to rebound, they must first firmly establish themselves above the 4100 level before having a chance to challenge the 4200 point, which happens to be where the downtrend line coincides with the resistance level. After successfully breaking through this level, 4370 will become the next target, followed by the 50-day moving average around 4500. Only by steadily establishing a foothold above 4500 can gold break free from the medium-term bearish pressure and gradually return to an upward trend.
Following the release of the minutes from the Federal Reserve's June policy meeting, the US dollar index retreated slightly. The minutes revealed a hawkish bias that was less pronounced than some market participants had anticipated. However, geopolitical risks remain significant. The escalating tensions between the US and Iran continue to support high international oil prices, fueling global concerns about persistently high inflation. Since gold itself does not generate interest income, and the high inflation environment will force the Federal Reserve to maintain a relatively tight policy stance, this significantly limits the upside potential of precious metal prices.
The meeting minutes revealed significant internal divisions within the Federal Reserve, with policymakers holding roughly equal views on whether to continue raising interest rates. Nine officials anticipated at least one more rate hike before the end of the year, while the remaining nine advocated maintaining the current interest rate level. This split within the Fed made it difficult for the market to predict the overall direction of the policy, leaving investors uncertain whether monetary policy would lean towards easing or tightening, leading to fluctuating risk aversion in the market.
Although the minutes did not substantially reinforce the argument for continued interest rate hikes, they also released almost no positive signals for interest rate cuts, completely shattering the market's optimistic illusions of a rapid interest rate cut cycle within the year. Market participants can only focus their subsequent judgments entirely on the various US economic indicators that will be released one after another, waiting for the data to provide clear guidance.
Currently, the market is betting on a roughly 65% probability of a Fed rate hike in September. Meanwhile, renewed geopolitical conflicts in the Middle East will continue to push up energy prices, further increasing uncertainty about inflation trends and adding challenges to the Fed's policy-making. If oil prices continue to surge, it will be difficult for US CPI data to fall back to the 2% target range, forcing the Fed to maintain its hawkish stance, which is a long-term negative factor for gold.
Considering the above factors, it is unlikely that real yields and the US dollar index will decline significantly in the short term. The strong dollar trend is unlikely to reverse in the short term, and gold's competitive disadvantage compared to interest-bearing assets will continue. This makes it difficult for gold prices to start a long and strong rebound, and the overall rebound will be significantly compressed.
The market's focus will now shift to the weekly initial jobless claims data in the US and public speeches by several Federal Reserve officials. These employment figures reflect the state of the US labor market, while officials' statements reveal their latest views on interest rate hikes and inflation, providing crucial clues for the future of monetary policy. In addition, the evolving situation in the Middle East is also closely watched by investors; if oil prices rise again, market anxiety about inflation will intensify, thereby suppressing the upward momentum of gold.
Technical Analysis
(Spot gold daily chart source: FX678)
After breaking below the symmetrical triangle pattern and the 200-day moving average, gold prices fell all the way to a low of around 3940, the lowest level since October last year. The successive breaches of previous bullish support levels triggered a large number of programmed stop-loss orders, exacerbating the previous downward trend in gold prices.
Although gold prices have temporarily stabilized, they remain below the downtrend line and the 50-day and 200-day moving averages, indicating a continued bearish medium- to long-term technical outlook. The moving average system has formed a downward-sloping resistance pattern, and the medium-term downtrend has not been reversed by this short-term rebound.
Short sellers will wait for gold prices to break below the key level of 3940, creating a new low for the current phase. At that point, gold prices will likely test the strong support level of 3800. If the 3940 support level is breached, bearish sentiment will intensify again, opening up significant downside potential.
If gold prices are to rebound, they must first firmly establish themselves above the 4100 level before having a chance to challenge the 4200 point, which happens to be where the downtrend line coincides with the resistance level. After successfully breaking through this level, 4370 will become the next target, followed by the 50-day moving average around 4500. Only by steadily establishing a foothold above 4500 can gold break free from the medium-term bearish pressure and gradually return to an upward trend.
- Risk Warning and Disclaimer
- The market involves risk, and trading may not be suitable for all investors. This article is for reference only and does not constitute personal investment advice, nor does it take into account certain users’ specific investment objectives, financial situation, or other needs. Any investment decisions made based on this information are at your own risk.