Will spot gold once again become a safe-haven asset?
2026-07-23 02:10:14
The past two trading days have been significant for gold's price movement. During this period, the precious metal rose by over 3.5%, indicating renewed short-term bullish momentum. Currently, buying power remains strong, with renewed tensions in the Middle East supporting demand for safe-haven assets. The market environment is favorable for gold demand, and if the situation continues, it may continue to support gold prices in the coming trading days.  In-depth Analysis: Is the Resurgence of the Middle East Conflict Having an Impact? Recent trading days have seen reports of Iran attacking an oil tanker in the Strait of Hormuz; simultaneously, the dispute over control of this crucial global trade route continues to escalate, with the US launching a new round of airstrikes against Iran. Furthermore, Iran has stated that no substantive negotiations will be conducted during the ongoing conflict; the US, in turn, claims that Iran has not shown any sincerity in seeking a diplomatic solution in the short term. The current situation continues to dampen overall market risk appetite. Stimulated by the conflict, West Texas Intermediate (WTI) crude oil prices briefly rose above $85, indicating that geopolitical risk premiums remain high. This situation has also reignited market concerns that global inflationary pressures may rise in the coming months. In fact, a market characteristic that was not very apparent in recent months has reappeared: as the Middle East conflict escalates, gold futures trading volume rises in tandem. From July 20th to 21st, the number of gold futures contracts traded increased significantly. As of the latest available data, the trading volume is close to 153,000 lots; the open interest, which measures the total open interest in the market, has also climbed to nearly 383,000 lots. Increased trading volume, rising gold prices, and simultaneously rising open interest often indicate the entry of new long positions into the futures market. This suggests that current gold buying is closely following developments in the Middle East situation, indicating that gold is once again being viewed as a safe-haven asset in the short term. It's worth noting that this round of gold buying coincides with the continued upward trend of the US 10-year Treasury yield. Currently, the yield is maintaining its upward trajectory, having broken through the 4.6% mark in the short term. In previous weeks, rising US Treasury yields typically put downward pressure on gold prices—bonds generate interest income, while gold does not. However, this traditional correlation has failed in recent trading days. This reflects a comprehensive increase in market demand for safe-haven assets in an environment where geopolitical conflicts have not yet shown clear signs of easing. At least in the short term, gold has regained favor with safe-haven funds, a phenomenon that has not been clearly observed for several months. In summary, there are two main reasons for the new round of gold buying. First, the market generally believes that the gold price decline in the past few months has been sufficient, and precious metals have room for a phase of recovery. Second, the continued tension in the Middle East is increasing uncertainty, and risk premiums are spreading outwards, leading funds to reallocate to traditional safe-haven assets like gold, in addition to the US dollar and US Treasury bonds. If the above market logic continues, gold prices are expected to continue to receive support in the short term, and relatively stable buying may continue in subsequent trading days. Technical Analysis Bear Market Trend Enters Key Risk Zone For several months, a long-term downward trend line on the daily chart has dominated gold price movements, representing the most important technical resistance structure. However, the recent rebound in gold prices has begun to test the lower edge of this trend line. If buying continues to exert force, the resistance of this downward trend line will weaken. Once broken, gold prices will likely enter a neutral trading range, or even form a stronger bullish trend, reversing the months-long bearish dominance.
 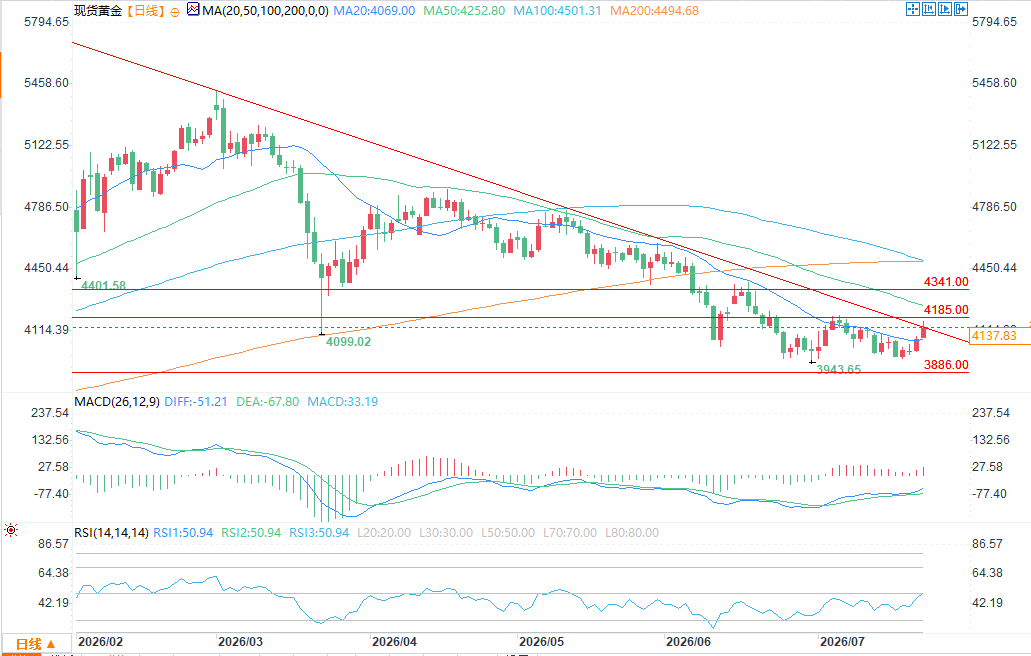 (Spot Gold Daily Chart Source: EasyForex) The Relative Strength Index (RSI) is approaching the 50 neutral level, indicating that the bullish and bearish forces have been relatively balanced over the past 14 periods. The indicator's movement reflects a market entering a directional decision-making phase; if the current state continues, the oscillating and range-bound market may persist. The Moving Average Convergence Divergence (MACD ) indicator shows similar signals, with the histogram remaining near the zero line. This indicates a basic balance between bullish and bearish momentum in the short term, further confirming that gold prices may be entering a period of unclear direction and oscillation. Key Level to Watch : $4341 – Key Resistance This level represents a recent important high, located above the 50-period simple moving average, and is also close to the 23.6% Fibonacci retracement level of the recent major decline. If gold prices test this level, the long-term downtrend line will face the risk of breaking; once broken, bullish forces will dominate in the coming weeks. $4185 – Short-Term Bullish/Bearish Dividing Line This is the recent consolidation zone, overlapping with multiple retracement levels. If gold prices continue to hover around this level, the oscillating pattern will solidify, forming a short-term range-bound market, and the influence of the long-term downtrend line will decrease accordingly. $3886 – a key support level – corresponds to the important low of October 2025 and is the next crucial line of defense for the bears. If gold prices fall back to this area, the bears will regain control, and the long-term downtrend will continue.
In-depth Analysis: Is the Resurgence of the Middle East Conflict Having an Impact? Recent trading days have seen reports of Iran attacking an oil tanker in the Strait of Hormuz; simultaneously, the dispute over control of this crucial global trade route continues to escalate, with the US launching a new round of airstrikes against Iran. Furthermore, Iran has stated that no substantive negotiations will be conducted during the ongoing conflict; the US, in turn, claims that Iran has not shown any sincerity in seeking a diplomatic solution in the short term. The current situation continues to dampen overall market risk appetite. Stimulated by the conflict, West Texas Intermediate (WTI) crude oil prices briefly rose above $85, indicating that geopolitical risk premiums remain high. This situation has also reignited market concerns that global inflationary pressures may rise in the coming months. In fact, a market characteristic that was not very apparent in recent months has reappeared: as the Middle East conflict escalates, gold futures trading volume rises in tandem. From July 20th to 21st, the number of gold futures contracts traded increased significantly. As of the latest available data, the trading volume is close to 153,000 lots; the open interest, which measures the total open interest in the market, has also climbed to nearly 383,000 lots. Increased trading volume, rising gold prices, and simultaneously rising open interest often indicate the entry of new long positions into the futures market. This suggests that current gold buying is closely following developments in the Middle East situation, indicating that gold is once again being viewed as a safe-haven asset in the short term. It's worth noting that this round of gold buying coincides with the continued upward trend of the US 10-year Treasury yield. Currently, the yield is maintaining its upward trajectory, having broken through the 4.6% mark in the short term. In previous weeks, rising US Treasury yields typically put downward pressure on gold prices—bonds generate interest income, while gold does not. However, this traditional correlation has failed in recent trading days. This reflects a comprehensive increase in market demand for safe-haven assets in an environment where geopolitical conflicts have not yet shown clear signs of easing. At least in the short term, gold has regained favor with safe-haven funds, a phenomenon that has not been clearly observed for several months. In summary, there are two main reasons for the new round of gold buying. First, the market generally believes that the gold price decline in the past few months has been sufficient, and precious metals have room for a phase of recovery. Second, the continued tension in the Middle East is increasing uncertainty, and risk premiums are spreading outwards, leading funds to reallocate to traditional safe-haven assets like gold, in addition to the US dollar and US Treasury bonds. If the above market logic continues, gold prices are expected to continue to receive support in the short term, and relatively stable buying may continue in subsequent trading days. Technical Analysis Bear Market Trend Enters Key Risk Zone For several months, a long-term downward trend line on the daily chart has dominated gold price movements, representing the most important technical resistance structure. However, the recent rebound in gold prices has begun to test the lower edge of this trend line. If buying continues to exert force, the resistance of this downward trend line will weaken. Once broken, gold prices will likely enter a neutral trading range, or even form a stronger bullish trend, reversing the months-long bearish dominance. (Spot Gold Daily Chart Source: EasyForex) The Relative Strength Index (RSI) is approaching the 50 neutral level, indicating that the bullish and bearish forces have been relatively balanced over the past 14 periods. The indicator's movement reflects a market entering a directional decision-making phase; if the current state continues, the oscillating and range-bound market may persist. The Moving Average Convergence Divergence (MACD ) indicator shows similar signals, with the histogram remaining near the zero line. This indicates a basic balance between bullish and bearish momentum in the short term, further confirming that gold prices may be entering a period of unclear direction and oscillation. Key Level to Watch : $4341 – Key Resistance This level represents a recent important high, located above the 50-period simple moving average, and is also close to the 23.6% Fibonacci retracement level of the recent major decline. If gold prices test this level, the long-term downtrend line will face the risk of breaking; once broken, bullish forces will dominate in the coming weeks. $4185 – Short-Term Bullish/Bearish Dividing Line This is the recent consolidation zone, overlapping with multiple retracement levels. If gold prices continue to hover around this level, the oscillating pattern will solidify, forming a short-term range-bound market, and the influence of the long-term downtrend line will decrease accordingly. $3886 – a key support level – corresponds to the important low of October 2025 and is the next crucial line of defense for the bears. If gold prices fall back to this area, the bears will regain control, and the long-term downtrend will continue.
- Risk Warning and Disclaimer
- The market involves risk, and trading may not be suitable for all investors. This article is for reference only and does not constitute personal investment advice, nor does it take into account certain users’ specific investment objectives, financial situation, or other needs. Any investment decisions made based on this information are at your own risk.