With the gold-silver ratio reaching 68, silver is gaining weight in both industrial and monetary accounting.
2026-09-14 21:36:08
On Monday, September 14th, spot silver was trading around $62.70 per ounce, down about 2.5% from Friday's close. Last Friday, the US core consumer price index rose 0.3% month-on-month in August, higher than the market forecast of 0.2%, and 2.4% year-on-year; however, after the weekend, the market refocused its attention on Wednesday's Federal Open Market Committee (FOMC) decision. Meanwhile, West Texas Intermediate (WTI) crude oil rose above $104 per barrel. Oil prices, real interest rates, and policy repricing occurred simultaneously, forming the main pricing dynamic for silver this week. 
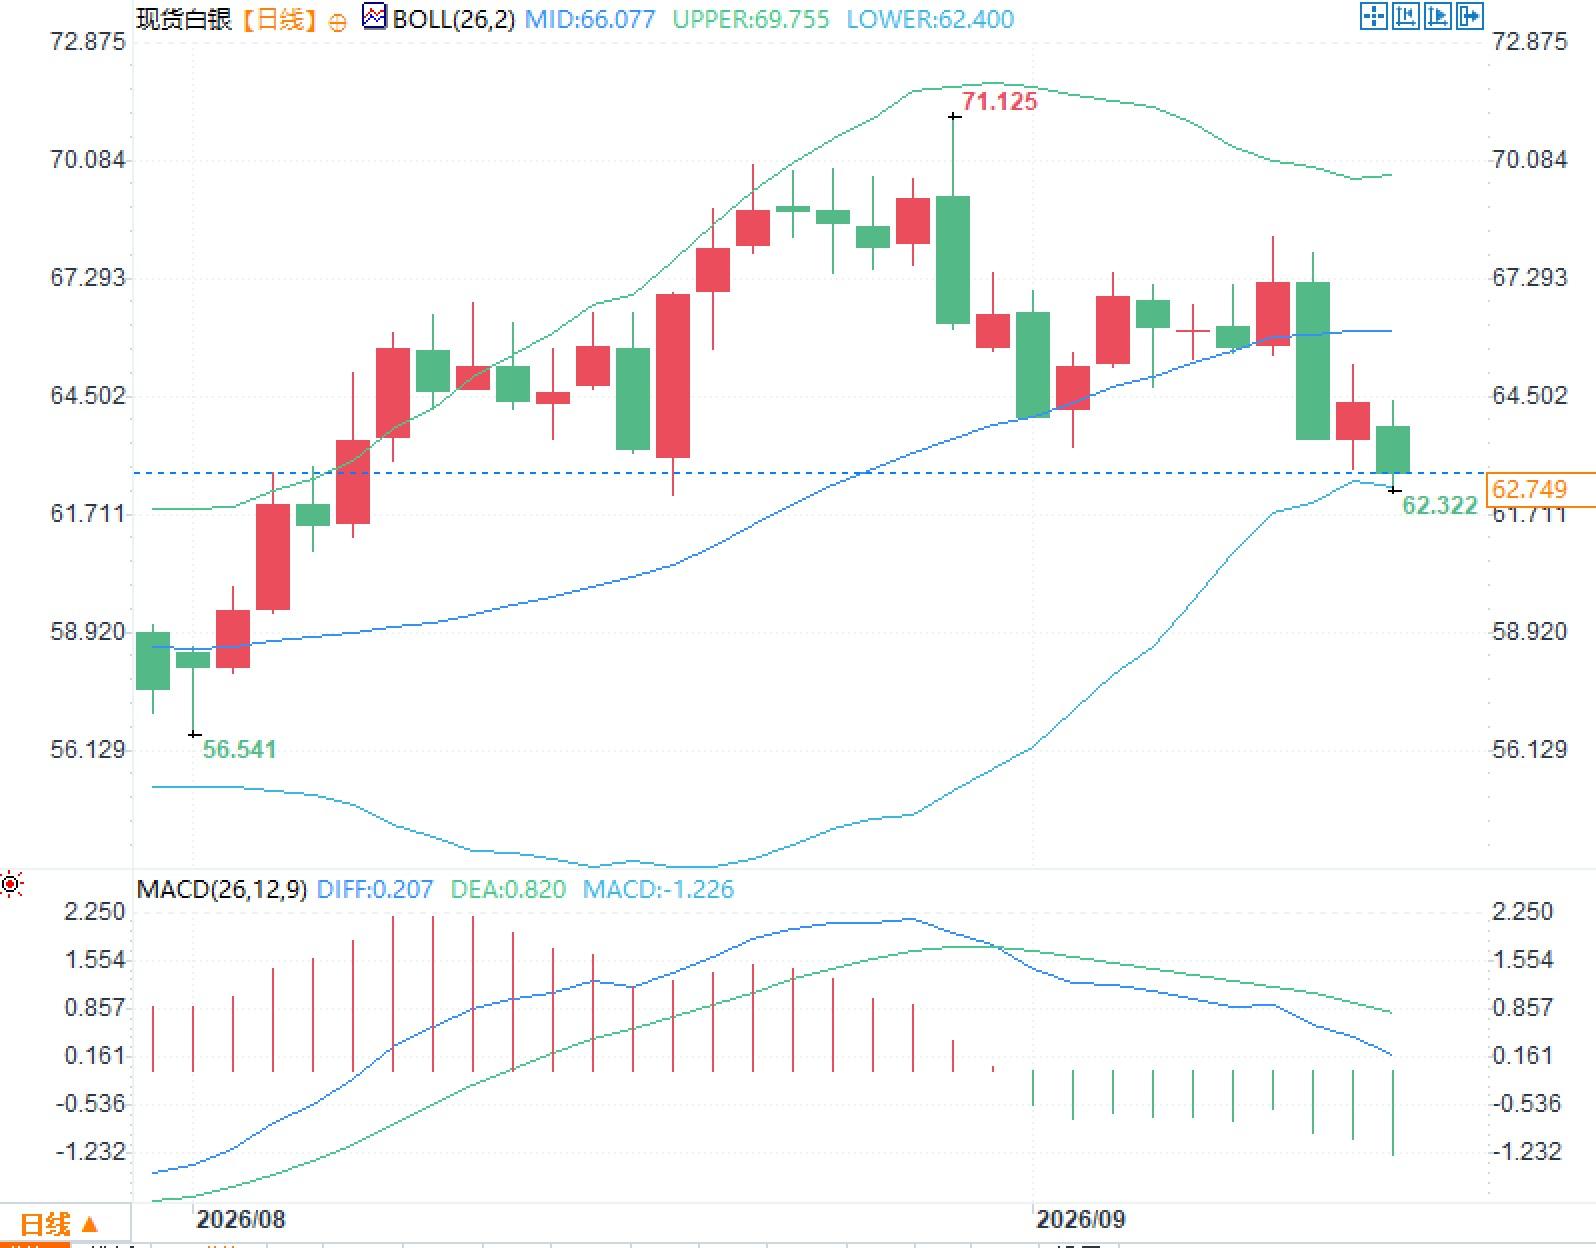 For silver, the first layer of impact from the meeting's outcome is transmitted through dollar funding costs and real yields, while the second layer is transmitted through risk appetite and the correlation with industrial metals. Silver's daily chart briefly touched a high of around $71.125 per ounce in late August, subsequently shifting its trading range downwards. The Bollinger Bands' middle band is around $66.08, the upper band around $69.76, and the lower band around $62.40, with the price trading closer to the lower band. The MACD histogram has turned from positive to negative, reflecting a completed momentum convergence.
Inflation readings alter path probabilities, not the immediate reaction function of the metal.
The US Consumer Price Index (CPI) rose 0.4% month-over-month and 3.4% year-over-year in August. The energy component rose 16.3% year-over-year, and gasoline rose 27.4% year-over-year, primarily driving the overall index higher. The market is more sensitive to the core CPI, excluding food and energy: the 0.3% month-over-month figure was higher than the consensus expectation of 0.2%, indicating that price stickiness did not follow the previous linear decline. Federal funds futures subsequently pushed the probability of a 25 basis point rate hike this Wednesday, raising the target range from 3.50%-3.75% to 3.75%-4.00%, to approximately 87%-88%. This is the first time since 2023 that rate hike expectations have been so concentratedly priced in. Silver did not immediately retrace on Friday following the path of "overheated inflation, increased probability of a rate hike, and pressure on non-interest-bearing assets," indicating that short-term pricing simultaneously digested the Middle East premium, physical liquidity, and previous declines. Monday's decline, however, re-priced in the previously postponed interest rate sensitivity. At the Jackson Hole Economic Symposium in late August, Federal Reserve Chairman Warsh said, "We must be confident that underlying inflation is moving toward our target at a sufficiently rapid and clear pace, or there is still work to be done." He also noted that the credit and lending markets "show little sign of policy constraints." These statements shifted the focus of this week's meeting from "whether to add 25 basis points" to "how the dot plot and statement describe the subsequent path." JPMorgan economist Feroli subsequently commented that if the chairman repeatedly emphasizes zero tolerance for inflation without taking action, it will jeopardize the institution's credibility.How will oil prices breaking through $100 reshape real interest rates and carrying costs?
Escalating conflicts in the Middle East, increased shipping attacks, and the shutdown of a Saudi pipeline bypassing the Strait of Hormuz have pushed crude oil prices back above $100 per barrel. Rising energy prices have increased inflation expectations, leading to upward revisions in both nominal and real yields. For silver, an asset that does not generate coupon income, a 10-year real yield rising to 2.55% means an increased opportunity cost of holding it. This is not just sentiment; it reflects changes in the discount rate: for every step up in real interest rates, assets with zero forward cash flow need to be balanced with a lower present price. The same mechanism also explains recent changes in the gold-silver ratio. Spot gold fluctuated between $4,280 and $4,330 per ounce on Monday, with a gold-silver ratio of approximately 68. Silver possesses both monetary and industrial attributes; during interest rate repricing phases, its volatility is often greater than that of gold; during oil price shocks, it absorbs both inflation premiums and expectations of slowing demand. Silver consumption in photovoltaics is projected to continue contracting in 2026, with total industrial consumption expected to fall to 639.6 million ounces, leaving a potential market shortfall of approximately 46.3 million ounces. The existence of a gap does not automatically translate into a one-way price movement, because inventory releases, lease rates, and investment demand will offset the physical gap within the same year. It is necessary to view the "supply and demand table" and the "discount rate" separately, rather than directly mapping an annual gap to a weekly direction.The resolution itself is already priced in; the statement and the dot plot are the sources of volatility.
The Fed's September 15-16 meeting has already largely priced in a 25 basis point rate hike in the futures market. Larger variables include the interest rate dot plot in the Summary of Economic Projections, the revision to the median policy rate at the end of 2026, and whether Warsh will characterize the oil price shock as a "one-off relative price change" or a "broad inflation risk that needs to be hedged with the policy rate." If the dot plot indicates another increase this year, the real interest rate channel will open further; if the statement emphasizes data dependence and separates energy price increases from core services, interest rate futures may give back some of the hawkish premium. For silver, the first layer of impact from the meeting's outcome is transmitted through dollar funding costs and real yields, while the second layer is transmitted through risk appetite and the correlation with industrial metals. Silver's daily chart briefly touched a high of around $71.125 per ounce in late August, subsequently shifting its trading range downwards. The Bollinger Bands' middle band is around $66.08, the upper band around $69.76, and the lower band around $62.40, with the price trading closer to the lower band. The MACD histogram has turned from positive to negative, reflecting a completed momentum convergence.The effect of dual attributes on silver
Silver pricing has long been situated between two sets of accounting principles. One is the monetary system: real interest rates, dollar liquidity, and safe-haven demand. The other is the industrial system: electronics and electrical equipment, automotive electrification, power grids, and data centers. Global silver demand is projected to fall to 1.1306 billion ounces in 2025, the lowest level since 2021; industrial consumption is projected at 657.4 million ounces, with silver savings in the photovoltaic sector offsetting the increased investment in AI infrastructure and power grids. Industrial consumption is expected to decline by another 3% in 2026, but mine supply elasticity is limited, with the deficit estimated by institutions to be in the 46 million ounce range for the sixth consecutive year. This means that the same Middle East news can simultaneously raise oil prices, increase the probability of interest rate hikes, and suppress industrial demand expectations. The redistribution of weight among these three forces leads to the combination of "overheated inflation data and silver prices rising initially before falling later." The European Central Bank has already adjusted its policy rates in response to the energy shock, and the paths of the Bank of Japan and the Bank of England are not synchronized with the Federal Reserve; cross-market interest rate differentials will change the financing and hedging costs of precious metals. If the situation in the Middle East shows a verifiable de-escalation this week, the decline in oil prices will simultaneously weaken inflation premiums and interest rate hike pricing; if supply disruptions continue, real interest rates and energy inflation may continue to run in parallel.- Risk Warning and Disclaimer
- The market involves risk, and trading may not be suitable for all investors. This article is for reference only and does not constitute personal investment advice, nor does it take into account certain users’ specific investment objectives, financial situation, or other needs. Any investment decisions made based on this information are at your own risk.