How far can the "artificial bull market" in LME copper go? Behind it lies a dramatic shift in inventory levels.
2025-11-25 20:47:52
On Tuesday (November 25), both London copper and Shanghai copper futures continued their recent rebound, closing higher. Three-month copper on the London Metal Exchange (LME) was quoted at $10,861.50 per tonne in Asian trading, up 0.82% on the day; the most active Shanghai copper contract closed at 86,590 yuan per tonne, up 0.64% for the day, marking two consecutive days of gains. Copper prices have now climbed to a near two-week high, and the market is searching for direction amidst a mix of bullish and bearish factors.

The direct driver of this round of copper price increases comes from a significant change in inventory structure. Copper inventories in LME-registered warehouses have decreased by 42% year-to-date, with a continuous flow to the US COMEX market, leading to a record high in the latter's inventories recently. This inventory transfer has created a short-term supply shortage in the LME market, most directly reflected in the spot copper premium over three-month copper rising to $25 per ton on Monday, reaching its highest level since mid-October.
Some analysts point out that this inventory movement reflects market concerns about potential tariff policies, leading to adjustments in inventory allocation to mitigate risks. This has created, to some extent, "artificial tension," causing the LME copper market to temporarily decouple from macroeconomic demand constraints and exhibit independent price movements.
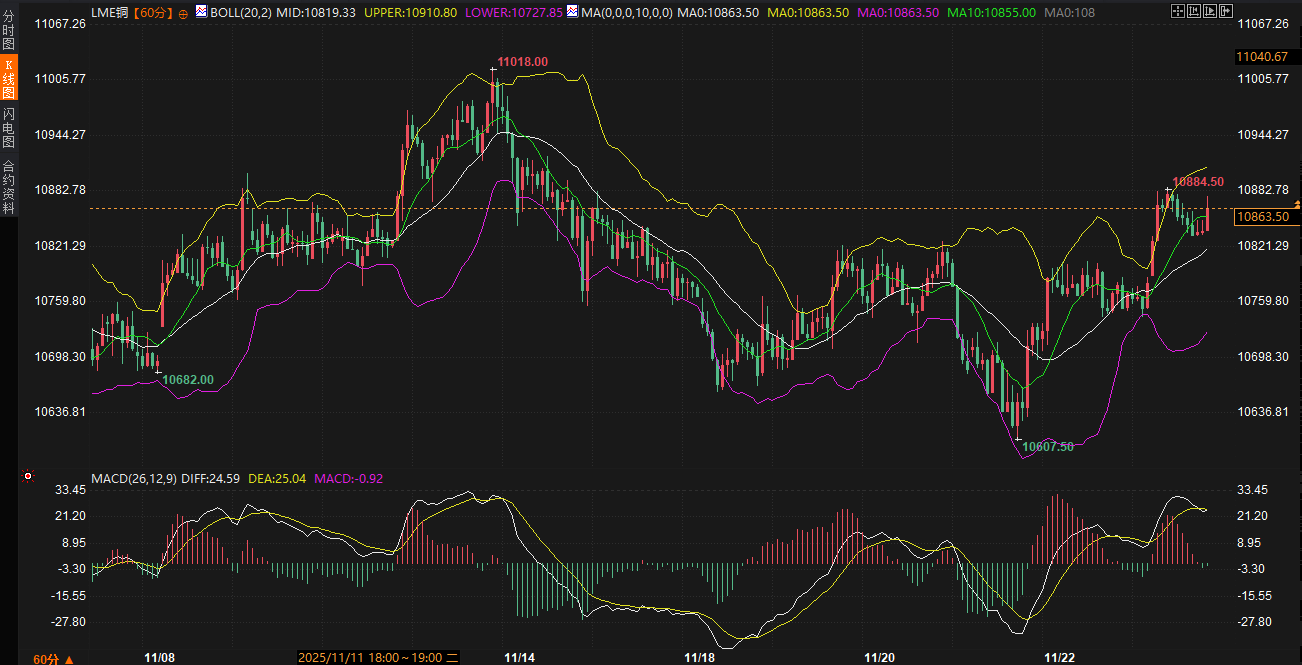
From a chart analysis perspective, LME copper prices have recently achieved a key technical breakout. Prices have successfully broken above the 21-day moving average, which is currently around $10,828 and has transformed from a previous resistance level into initial short-term support. The current price is trading above the Bollinger Band middle line at $10,819.25, and the 10-period simple moving average is at $10,854.90, roughly in line with the current price, indicating a short-term equilibrium in the market.
On the fundamental side, both supporting and restraining factors coexist. On the positive side, market expectations for another Federal Reserve rate cut this year have increased, and a weaker dollar has provided support for dollar-denominated copper prices. Meanwhile, upward revisions to copper price forecasts for this year and next by the Chilean mining sector, along with concerns about potential supply tightening at Indonesia's Grasberg mine, have boosted market sentiment.
However, negative factors cannot be ignored either. The Yangshan copper premium fell 6% to $32 on Tuesday, retreating to a four-month low reached a week earlier, suggesting that physical demand has not kept pace with the enthusiasm in the futures market.
In summary, copper prices are currently caught in a tug-of-war between short-term positive factors and medium- to long-term concerns. The persistent inverse spread structure in the futures market indicates tight near-term supply, but relatively stable long-term price expectations suggest that the sustainability of the current strength is questionable.
For future price movements, identifying key support and resistance levels is crucial. Short-term support for LME copper lies in the $10,800-$10,830 range, which coincides with the 21-day moving average and the Bollinger Band's middle line. Resistance is seen in the $10,950-$11,000 range, close to the previous high for the month. For SHFE copper, the 85,000-85,500 yuan range provides significant support, while the 87,500-88,000 yuan range forms recent resistance.
During trading, key factors to watch include the sustainability of inventory changes, fluctuations in spot premiums and discounts, and shifts in macroeconomic sentiment, as these factors can trigger sharp short-term price swings. The future direction of copper prices will depend on the interplay between the "tight supply narrative" and the "realities of macroeconomic demand."
Inventory transfer dominates short-term logic; LME shows structural tightness.
The direct driver of this round of copper price increases comes from a significant change in inventory structure. Copper inventories in LME-registered warehouses have decreased by 42% year-to-date, with a continuous flow to the US COMEX market, leading to a record high in the latter's inventories recently. This inventory transfer has created a short-term supply shortage in the LME market, most directly reflected in the spot copper premium over three-month copper rising to $25 per ton on Monday, reaching its highest level since mid-October.
Some analysts point out that this inventory movement reflects market concerns about potential tariff policies, leading to adjustments in inventory allocation to mitigate risks. This has created, to some extent, "artificial tension," causing the LME copper market to temporarily decouple from macroeconomic demand constraints and exhibit independent price movements.
Technically, the price has broken through key moving averages, and the short-term structure has turned into support.
From a chart analysis perspective, LME copper prices have recently achieved a key technical breakout. Prices have successfully broken above the 21-day moving average, which is currently around $10,828 and has transformed from a previous resistance level into initial short-term support. The current price is trading above the Bollinger Band middle line at $10,819.25, and the 10-period simple moving average is at $10,854.90, roughly in line with the current price, indicating a short-term equilibrium in the market.
Macroeconomic and fundamental factors are intertwined, creating a complex mix of bullish and bearish trends.
On the fundamental side, both supporting and restraining factors coexist. On the positive side, market expectations for another Federal Reserve rate cut this year have increased, and a weaker dollar has provided support for dollar-denominated copper prices. Meanwhile, upward revisions to copper price forecasts for this year and next by the Chilean mining sector, along with concerns about potential supply tightening at Indonesia's Grasberg mine, have boosted market sentiment.
However, negative factors cannot be ignored either. The Yangshan copper premium fell 6% to $32 on Tuesday, retreating to a four-month low reached a week earlier, suggesting that physical demand has not kept pace with the enthusiasm in the futures market.
Market Outlook and Key Range Analysis
In summary, copper prices are currently caught in a tug-of-war between short-term positive factors and medium- to long-term concerns. The persistent inverse spread structure in the futures market indicates tight near-term supply, but relatively stable long-term price expectations suggest that the sustainability of the current strength is questionable.
For future price movements, identifying key support and resistance levels is crucial. Short-term support for LME copper lies in the $10,800-$10,830 range, which coincides with the 21-day moving average and the Bollinger Band's middle line. Resistance is seen in the $10,950-$11,000 range, close to the previous high for the month. For SHFE copper, the 85,000-85,500 yuan range provides significant support, while the 87,500-88,000 yuan range forms recent resistance.
During trading, key factors to watch include the sustainability of inventory changes, fluctuations in spot premiums and discounts, and shifts in macroeconomic sentiment, as these factors can trigger sharp short-term price swings. The future direction of copper prices will depend on the interplay between the "tight supply narrative" and the "realities of macroeconomic demand."
- Risk Warning and Disclaimer
- The market involves risk, and trading may not be suitable for all investors. This article is for reference only and does not constitute personal investment advice, nor does it take into account certain users’ specific investment objectives, financial situation, or other needs. Any investment decisions made based on this information are at your own risk.