Gold's continuous surge raises the question: is it a sign of weakening upward momentum or a false breakout?
2025-12-08 21:53:50
On Monday (December 8), spot gold (XAU/USD) continued its upward trend during the Asian and European sessions, falling back after reaching a high on Friday. It is currently trading around $4205. The rise and fall over the past two trading days indicates that the upward momentum of gold prices is weakening, and the market may have begun to bet on a hawkish rate cut by the Federal Reserve.
However, gold is not entirely without opportunities. The recent rise in US Treasury bonds but the lack of a corresponding rise in the US dollar index may have revealed some important information. The precious metals market is entering a critical stage of the battle between bulls and bears.
Meanwhile, the continuous gold-buying spree by central banks around the world, led by the People's Bank of China, has further solidified the medium-term bullish outlook for gold.

A rise in the yield on 10-year US Treasury bonds would attract funds to purchase them, thus increasing the US dollar index. However, this time, US Treasury bonds and the US dollar have diverged, indicating that funds have not been affected by US Treasury bonds. In other words, funds need even higher yields to allocate to US Treasury bonds.
As is well known, the yield on 10-year US Treasury bonds equals the real interest rate plus expected risk premium. This means that the market believes that US inflation and holding long-term US Treasury bonds require more risk premium, which is beneficial to gold.
Meanwhile, the continued weakness of the US dollar index is also a key factor in the potential for a turnaround in gold prices.
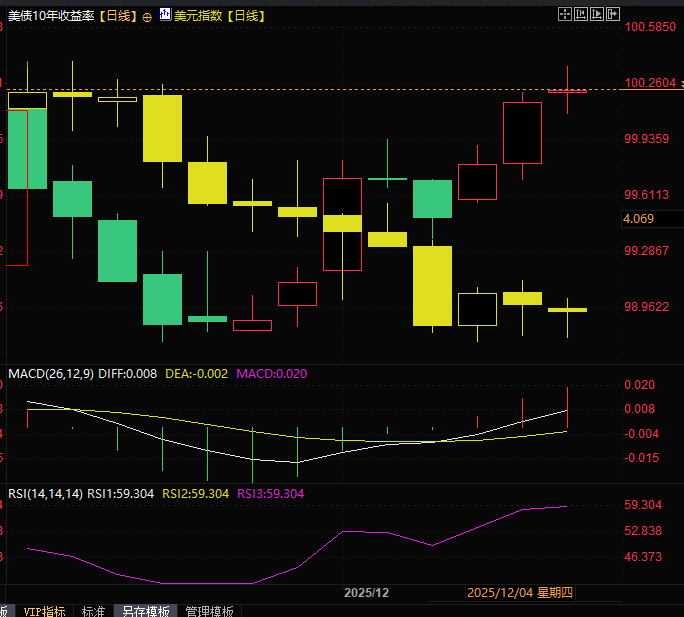
(Daily chart of US 10-year Treasury yield and US dollar index)
The U.S. September Personal Consumption Expenditures (PCE) figures released on Friday night were slightly lower than expected, alleviating some of the Federal Reserve's concerns about inflation and paving the way for an interest rate cut. The data showed that after adjusting for inflation, consumption in September was nearly stagnant, with the previous value revised down to 0.2%. Core PCE rose 2.8% year-on-year, indicating that the cooling of inflation was uneven, but the pressure eased marginally.
During the same period, inflation-adjusted disposable income stagnated for the second consecutive month, while nominal wages rose by 0.4%; September saw the largest drop in goods spending since May, as the middle class turned to discount channels to purchase goods due to employment and budget pressures.
Furthermore, although the Michigan Consumer Sentiment Index rose to 53.3 in December, exceeding the expected 52, the cooling of inflation expectations (4.1% for the next year and 3.2% for five years) still creates conditions for the Federal Reserve to cut interest rates.
The U.S. ADP employment figure unexpectedly fell by 32,000 in November, the largest drop since March 2023, far below the market expectation of an increase of 5,000. This combination of "moderate inflation + cooling employment" further solidifies the logical basis for policy easing.
Lower interest rates will directly weaken the US dollar and US Treasury yields, providing support for gold.
The continued gold purchases by central banks around the world are the core support for the long-term bullish trend in gold.
The People's Bank of China has increased its gold reserves for 13 consecutive months, reaching a total of 74.12 million ounces by the end of November 2025, an increase of 30,000 ounces from the previous month. This consistent increase highlights gold's irreplaceable status as a strategic reserve asset during periods of monetary uncertainty or geopolitical tension. Beyond China, data from the World Gold Council shows that global central banks' net gold purchases reached 220 tons in the third quarter of 2025, a 28% increase quarter-on-quarter, with 95% of surveyed institutions planning to continue increasing their holdings over the next 12 months. This stable buying by global central banks has provided solid support for gold prices.
The influx of institutional funds has further strengthened the bullish momentum. A report released by the World Gold Council on December 5th showed that global gold ETFs recorded inflows for the sixth consecutive month in November, with an additional $5.2 billion, pushing assets under management to a record $530 billion, demonstrating strong demand for gold from institutional investors. The combined buying from central banks and ETFs has provided strong support for gold even during short-term fluctuations, and the medium- to long-term upward trend remains unchanged.
Geopolitical risks continue to provide safe-haven support for gold. The Russia-Ukraine conflict and the renewed border tensions between Thailand and Cambodia are bullish catalysts that cannot be ignored in the short term. These factors, along with the pressure from the strengthening US dollar, are creating a tug-of-war, causing gold to maintain a range-bound trading pattern before the decision.
Spot gold has seen a rise followed by a fall in the last two trading days.
However, gold prices are currently holding above the lower boundary of the upward channel. If they break below this boundary, a corrective wave will begin, and a pullback after a surge indicates that the bulls have exhausted their strength and the breakout has failed.
However, another possibility is that gold prices will begin to break through quickly, and the breakthrough will be very fast, directly breaking through the 4235 level. After the price rises and falls back, the breakthrough will indicate that the bulls' test is over.
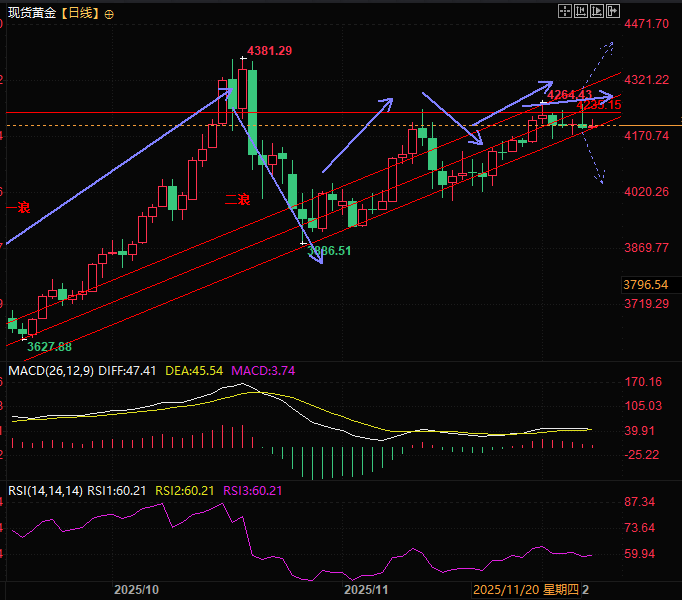
(Spot gold daily chart, source: FX678)
At 21:52 Beijing time, spot gold was trading at $4199.28 per ounce.
However, gold is not entirely without opportunities. The recent rise in US Treasury bonds but the lack of a corresponding rise in the US dollar index may have revealed some important information. The precious metals market is entering a critical stage of the battle between bulls and bears.
Meanwhile, the continuous gold-buying spree by central banks around the world, led by the People's Bank of China, has further solidified the medium-term bullish outlook for gold.
The divergence between the US dollar and US Treasury bond trends holds hidden meaning.
A rise in the yield on 10-year US Treasury bonds would attract funds to purchase them, thus increasing the US dollar index. However, this time, US Treasury bonds and the US dollar have diverged, indicating that funds have not been affected by US Treasury bonds. In other words, funds need even higher yields to allocate to US Treasury bonds.
As is well known, the yield on 10-year US Treasury bonds equals the real interest rate plus expected risk premium. This means that the market believes that US inflation and holding long-term US Treasury bonds require more risk premium, which is beneficial to gold.
Meanwhile, the continued weakness of the US dollar index is also a key factor in the potential for a turnaround in gold prices.
(Daily chart of US 10-year Treasury yield and US dollar index)
US inflation data released below expectations paves the way for interest rate cuts.
The U.S. September Personal Consumption Expenditures (PCE) figures released on Friday night were slightly lower than expected, alleviating some of the Federal Reserve's concerns about inflation and paving the way for an interest rate cut. The data showed that after adjusting for inflation, consumption in September was nearly stagnant, with the previous value revised down to 0.2%. Core PCE rose 2.8% year-on-year, indicating that the cooling of inflation was uneven, but the pressure eased marginally.
During the same period, inflation-adjusted disposable income stagnated for the second consecutive month, while nominal wages rose by 0.4%; September saw the largest drop in goods spending since May, as the middle class turned to discount channels to purchase goods due to employment and budget pressures.
Furthermore, although the Michigan Consumer Sentiment Index rose to 53.3 in December, exceeding the expected 52, the cooling of inflation expectations (4.1% for the next year and 3.2% for five years) still creates conditions for the Federal Reserve to cut interest rates.
The U.S. ADP employment figure unexpectedly fell by 32,000 in November, the largest drop since March 2023, far below the market expectation of an increase of 5,000. This combination of "moderate inflation + cooling employment" further solidifies the logical basis for policy easing.
Lower interest rates will directly weaken the US dollar and US Treasury yields, providing support for gold.
The central bank and ETFs are working in tandem, with medium- to long-term buying forming a solid bottom.
The continued gold purchases by central banks around the world are the core support for the long-term bullish trend in gold.
The People's Bank of China has increased its gold reserves for 13 consecutive months, reaching a total of 74.12 million ounces by the end of November 2025, an increase of 30,000 ounces from the previous month. This consistent increase highlights gold's irreplaceable status as a strategic reserve asset during periods of monetary uncertainty or geopolitical tension. Beyond China, data from the World Gold Council shows that global central banks' net gold purchases reached 220 tons in the third quarter of 2025, a 28% increase quarter-on-quarter, with 95% of surveyed institutions planning to continue increasing their holdings over the next 12 months. This stable buying by global central banks has provided solid support for gold prices.
The influx of institutional funds has further strengthened the bullish momentum. A report released by the World Gold Council on December 5th showed that global gold ETFs recorded inflows for the sixth consecutive month in November, with an additional $5.2 billion, pushing assets under management to a record $530 billion, demonstrating strong demand for gold from institutional investors. The combined buying from central banks and ETFs has provided strong support for gold even during short-term fluctuations, and the medium- to long-term upward trend remains unchanged.
Geopolitical crises still exist
Geopolitical risks continue to provide safe-haven support for gold. The Russia-Ukraine conflict and the renewed border tensions between Thailand and Cambodia are bullish catalysts that cannot be ignored in the short term. These factors, along with the pressure from the strengthening US dollar, are creating a tug-of-war, causing gold to maintain a range-bound trading pattern before the decision.
Technical Analysis:
Spot gold has seen a rise followed by a fall in the last two trading days.
However, gold prices are currently holding above the lower boundary of the upward channel. If they break below this boundary, a corrective wave will begin, and a pullback after a surge indicates that the bulls have exhausted their strength and the breakout has failed.
However, another possibility is that gold prices will begin to break through quickly, and the breakthrough will be very fast, directly breaking through the 4235 level. After the price rises and falls back, the breakthrough will indicate that the bulls' test is over.
(Spot gold daily chart, source: FX678)
At 21:52 Beijing time, spot gold was trading at $4199.28 per ounce.
- Risk Warning and Disclaimer
- The market involves risk, and trading may not be suitable for all investors. This article is for reference only and does not constitute personal investment advice, nor does it take into account certain users’ specific investment objectives, financial situation, or other needs. Any investment decisions made based on this information are at your own risk.