Gold's rebound is weak, with resistance at $5,000 becoming apparent; be wary of a second wave of selling pressure.
2026-02-05 19:27:24
Gold failed to continue its previous strong rebound during the European session on Thursday (February 5). Spot gold is currently fluctuating between $4,790 and $5,023, having fallen by more than 2% during the session, further confirming that the resistance above $5,000 is not just short-term noise, and this level has become a key resistance for the current market.

The sharp drop triggered by the "Warsh Shock" at the beginning of the year has clearly not been fully digested by the market. Although gold prices have seen a technical recovery from the $4,400 level, the rebound has been slow and weak, evolving into a rounded, entangled structure between bulls and bears. Historically, this type of pattern is not the starting point of a new major upward trend, but rather a transitional phase before the bears regroup. The current sideways movement and gradual weakening are typical characteristics of this structure.
Market logic has shifted from an extreme bull market to a period of high volatility correction.
From an extreme bull market to a high-volatility correction, the core logic of the gold market has fundamentally changed. Looking back at 2025, gold deviated from conventional valuation frameworks, accelerating its upward trend driven by a confluence of central bank gold purchases, geopolitical risks, and a weakening dollar, exhibiting clear sentiment-driven characteristics and a high concentration of leveraged and speculative funds. However, this logic was quickly disrupted in 2026. At the end of January, gold prices plummeted from a high of $5,600 to around $4,400, a drop and speed far exceeding normal corrections, resembling a stampede of positions. The subsequent rebound, while considerable, lacked sustainability, clearly encountering resistance around $5,100 and failing to form a new trend structure. This combination of "rapid decline and slow rebound" itself indicates a shift in market risk appetite.
Fundamentals: Sufficient support, insufficient upward momentum.
From a fundamental perspective, gold is currently facing a fading of overall favorable conditions. Rising expectations of high interest rates and a strong dollar are pushing up the cost of holding gold, making asset allocation more cautious. Although central bank gold purchases and physical demand in Asia remain, these forces only act as a buffer and cannot accelerate price increases. In addition, given the previous large gains and the fact that speculative positions have not yet fully cooled, the market is more inclined to view the rebound as a technical correction rather than the start of a new round of market activity. The fundamentals have not opened up new room for upward imagination, but have only slowed the downward trend.
Technical Analysis: The rebound resembles a "dead cat bounce," and the rounded top pattern confirms the bearish bias.
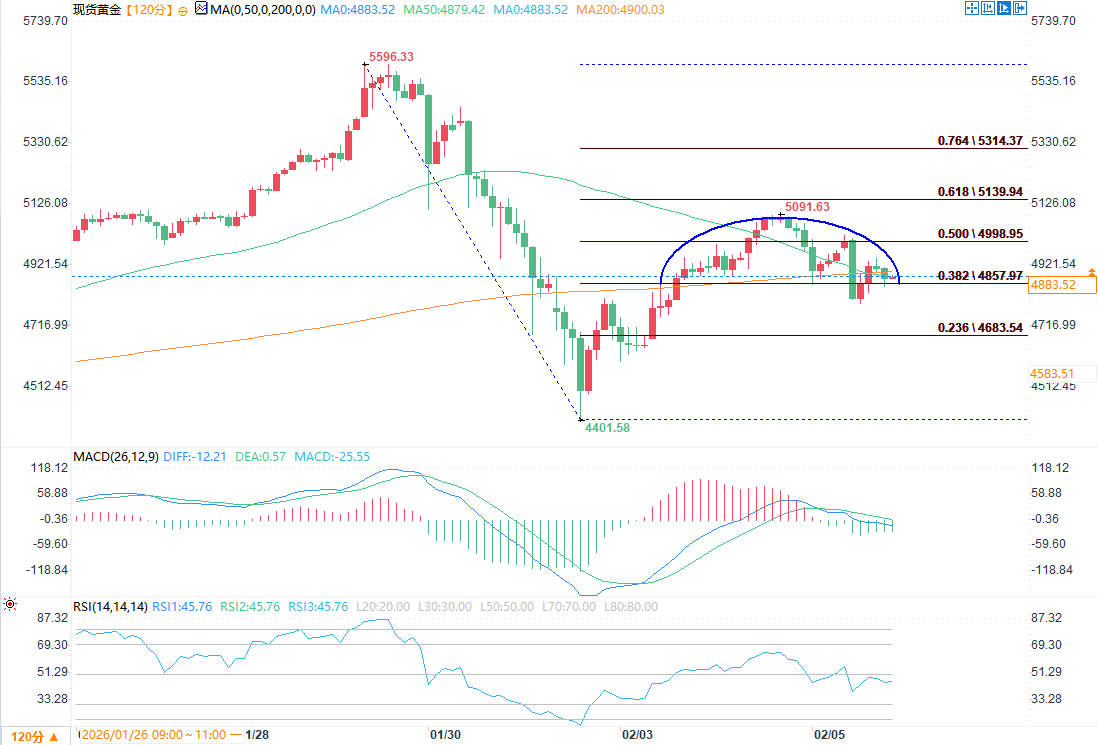
(2-hour chart of spot gold source: EasyForex)
From a technical perspective, the short-term rebound in gold is more like a "dead cat bounce" than a trend reversal. The rapid rise after the decline was not accompanied by increased trading volume, and momentum indicators showed limited recovery. The $5,000 level has transformed from a psychological barrier into a substantial supply zone—long positions trapped at higher levels and short-term speculative funds are continuously releasing selling pressure in this area, causing prices to stall on each attempt to break through. Short- and medium-term moving averages are providing resistance, and technical indicators are generally operating in a bearish range. The rebound is more of a time-for-space consolidation than a trend reversal. The rounded top pattern formed in the $4,900–$5,100 range after the rebound from the $4,401.58 low further confirms this assessment.
Risk Outlook: Be wary of a second wave of selling pressure; support levels are key.
From a risk perspective, the market's process of reallocating resources through a volatile rebound after the initial plunge is essentially preparing for the next wave of volatility. The previous sharp sell-off did not fully release all risks. Without a substantial shift in the dollar and interest rate environment, gold lacks the macroeconomic foundation for a renewed strength. Technically, the $4840-$4790 range is a crucial short-term support area. A decisive break below this level could accelerate the price towards $4600 or even the previous lows, and the possibility of a second wave of selling pressure should not be ignored.
Strategy Summary: Focus on defense, and be cautious in dealing with rebounds.
Considering both fundamentals and technical structure, gold remains in a phase of weak rebound, unclear direction, and downward bias in the short term. Below $5000, a prudent approach should prioritize defense and risk control, rather than aggressively betting on a reversal—sell-off pressure is more likely to occur when the rebound approaches key resistance areas than a trend continuation. Only when the price effectively stabilizes above $5100, accompanied by a simultaneous improvement in trading volume and momentum, will it signify a genuine shift in the market structure. Until then, cautious action and dynamic adjustments are more important than a single-directional conviction.
The sharp drop triggered by the "Warsh Shock" at the beginning of the year has clearly not been fully digested by the market. Although gold prices have seen a technical recovery from the $4,400 level, the rebound has been slow and weak, evolving into a rounded, entangled structure between bulls and bears. Historically, this type of pattern is not the starting point of a new major upward trend, but rather a transitional phase before the bears regroup. The current sideways movement and gradual weakening are typical characteristics of this structure.
Market logic has shifted from an extreme bull market to a period of high volatility correction.
From an extreme bull market to a high-volatility correction, the core logic of the gold market has fundamentally changed. Looking back at 2025, gold deviated from conventional valuation frameworks, accelerating its upward trend driven by a confluence of central bank gold purchases, geopolitical risks, and a weakening dollar, exhibiting clear sentiment-driven characteristics and a high concentration of leveraged and speculative funds. However, this logic was quickly disrupted in 2026. At the end of January, gold prices plummeted from a high of $5,600 to around $4,400, a drop and speed far exceeding normal corrections, resembling a stampede of positions. The subsequent rebound, while considerable, lacked sustainability, clearly encountering resistance around $5,100 and failing to form a new trend structure. This combination of "rapid decline and slow rebound" itself indicates a shift in market risk appetite.
Fundamentals: Sufficient support, insufficient upward momentum.
From a fundamental perspective, gold is currently facing a fading of overall favorable conditions. Rising expectations of high interest rates and a strong dollar are pushing up the cost of holding gold, making asset allocation more cautious. Although central bank gold purchases and physical demand in Asia remain, these forces only act as a buffer and cannot accelerate price increases. In addition, given the previous large gains and the fact that speculative positions have not yet fully cooled, the market is more inclined to view the rebound as a technical correction rather than the start of a new round of market activity. The fundamentals have not opened up new room for upward imagination, but have only slowed the downward trend.
Technical Analysis: The rebound resembles a "dead cat bounce," and the rounded top pattern confirms the bearish bias.
(2-hour chart of spot gold source: EasyForex)
From a technical perspective, the short-term rebound in gold is more like a "dead cat bounce" than a trend reversal. The rapid rise after the decline was not accompanied by increased trading volume, and momentum indicators showed limited recovery. The $5,000 level has transformed from a psychological barrier into a substantial supply zone—long positions trapped at higher levels and short-term speculative funds are continuously releasing selling pressure in this area, causing prices to stall on each attempt to break through. Short- and medium-term moving averages are providing resistance, and technical indicators are generally operating in a bearish range. The rebound is more of a time-for-space consolidation than a trend reversal. The rounded top pattern formed in the $4,900–$5,100 range after the rebound from the $4,401.58 low further confirms this assessment.
Risk Outlook: Be wary of a second wave of selling pressure; support levels are key.
From a risk perspective, the market's process of reallocating resources through a volatile rebound after the initial plunge is essentially preparing for the next wave of volatility. The previous sharp sell-off did not fully release all risks. Without a substantial shift in the dollar and interest rate environment, gold lacks the macroeconomic foundation for a renewed strength. Technically, the $4840-$4790 range is a crucial short-term support area. A decisive break below this level could accelerate the price towards $4600 or even the previous lows, and the possibility of a second wave of selling pressure should not be ignored.
Strategy Summary: Focus on defense, and be cautious in dealing with rebounds.
Considering both fundamentals and technical structure, gold remains in a phase of weak rebound, unclear direction, and downward bias in the short term. Below $5000, a prudent approach should prioritize defense and risk control, rather than aggressively betting on a reversal—sell-off pressure is more likely to occur when the rebound approaches key resistance areas than a trend continuation. Only when the price effectively stabilizes above $5100, accompanied by a simultaneous improvement in trading volume and momentum, will it signify a genuine shift in the market structure. Until then, cautious action and dynamic adjustments are more important than a single-directional conviction.
- Risk Warning and Disclaimer
- The market involves risk, and trading may not be suitable for all investors. This article is for reference only and does not constitute personal investment advice, nor does it take into account certain users’ specific investment objectives, financial situation, or other needs. Any investment decisions made based on this information are at your own risk.