Gold prices fell to a 10-day low; technical breakdown under multiple pressures and future outlook.
2026-02-17 18:55:37
On Tuesday (February 17), during the European session, the spot gold price chart showed that it had fallen below the low of February 12, reaching its lowest level in 10 days, trading around $4,918. Market analysts believe that multiple factors are suppressing gold prices, coupled with a technical breakdown, and gold bulls are facing a period of testing.

Fundamental pressures: Risk aversion recedes and policy expectations are reassessed.
With the US-Iran and Russia-Ukraine negotiations making some progress, the safe-haven sentiment that had previously supported gold prices has cooled significantly. Market pricing in tail risks such as escalating conflicts in the Middle East and disruptions to European energy supplies has gradually subsided, significantly reducing gold's appeal as a "crisis hedge." Investors are turning to riskier assets, and funds are flowing out of gold ETFs and safe-haven asset pools, further limiting the upside potential of gold prices.
The latest US CPI data shows that inflation has slowed to below market expectations, and the core PCE price index has also declined. This has led traders to reassess the Federal Reserve's monetary policy path in 2026: the market's probability of a rate cut in March has fallen from 70% at the beginning of the month to less than 50%, and the expected number of rate cuts for the whole year has also been lowered from 6 to 4. The rise in real interest rate expectations has directly weakened the relative value of gold, a non-interest-bearing asset, becoming the core driving force behind the downward pressure on gold prices.
With the US President's Day holiday and the Asian Lunar New Year holidays, trading volumes at major global gold trading centers (New York, London, and Shanghai) declined significantly. In this sluggish trading environment, even small, large orders could trigger sharp price fluctuations, allowing short sellers to take advantage of the situation and amplify the decline in gold prices.
Technical Breakout: From "Bull Trap" to Trend Rebalancing
In our analysis of gold price trends on February 9th, we pointed out:
(Spot gold 1-hour chart source: EasyForex)
The long-term upward trend has been confirmed to remain valid.
After the extreme volatility surge at the beginning of the month, the market is likely to enter a phase of re-finding equilibrium.
Gold price volatility is expected to narrow, and the balance between bulls and bears may be reached around the psychological level of $5,000.
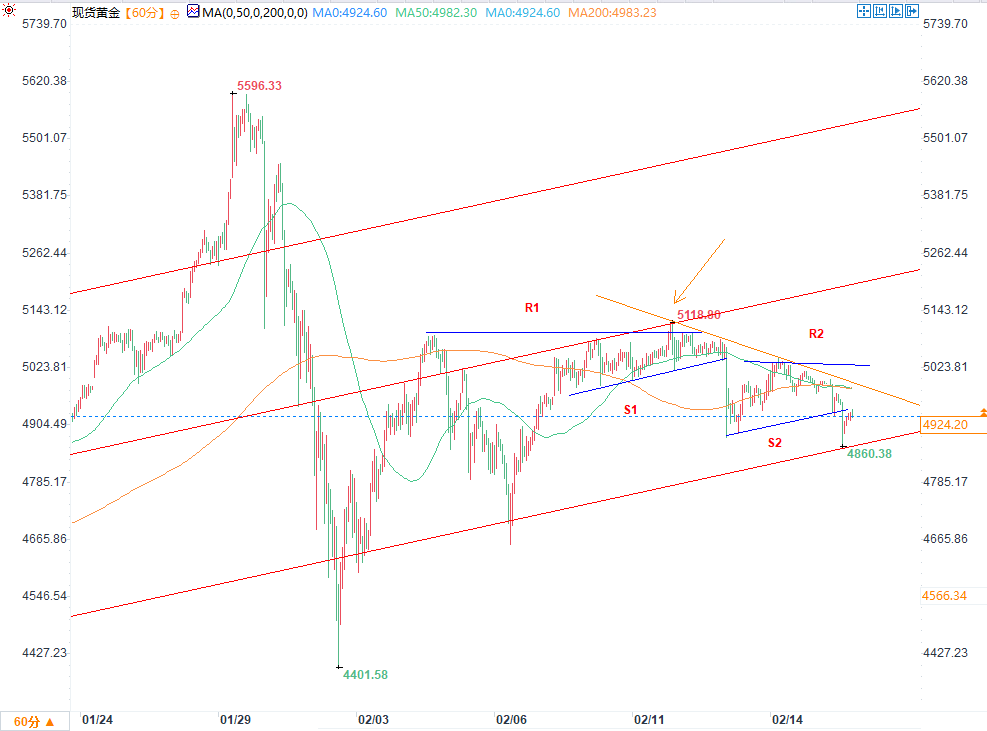
Indeed, from February 9th to 12th, gold prices formed a consolidation range above $5,000, specifically between the resistance level R1 (approximately $5,100) and the local support level S1 (approximately $5,000).
The arrow in the chart indicates a false upward breakout: gold prices briefly surged above R1 before quickly falling back, failing to hold the key resistance level. This suggests that the bulls were unable to maintain the upward momentum, instead forming a "bull trap." This movement exposed the exhaustion of bullish momentum, giving the bears an opportunity to regain control.
After gold prices decisively broke below the S1 support level ($5000), this level quickly transformed into the resistance level R2. This is clearly evident from today's downward trend:
The bears remain in control, and gold prices have broken below the local support level S2 (approximately $4,900).
The short-term moving averages have formed a death cross, and the MACD histogram continues to expand, indicating a clear bearish signal from a technical perspective.
The key support level for the bulls lies at the lower trendline of the long-term upward channel (around $4850). Since February, gold prices have twice fallen back into the long-term upward channel, and it is highly likely that they will continue to trade within the channel. It is worth noting that if gold prices strongly break through the yellow resistance line in the chart (around $5050), it can be considered a bullish flag pattern breakout, and the bulls are expected to restart their upward trend, challenging the previous high of $5200.
Market Outlook: Focus on Two Key Variables
In the short term, gold prices will depend on two key variables:
Federal Reserve policy signals: If subsequent employment or inflation data exceed expectations again, market bets on interest rate cuts may cool further, and gold prices may test the lower support level of the channel.
Geopolitical risks are recurring: If the situation in the Middle East or Eastern Europe escalates again, safe-haven demand may return quickly, and gold is expected to rebound based on the lower rail of the channel.
In the medium term, as long as the long-term upward channel is not effectively broken, the bullish tone for gold remains unchanged. Investors need to closely monitor the support level of the lower channel line and the battle between bulls and bears at the $5,000 mark, as these will be the key watershed for determining whether gold enters a deep correction or resumes its upward trend.
Fundamental pressures: Risk aversion recedes and policy expectations are reassessed.
With the US-Iran and Russia-Ukraine negotiations making some progress, the safe-haven sentiment that had previously supported gold prices has cooled significantly. Market pricing in tail risks such as escalating conflicts in the Middle East and disruptions to European energy supplies has gradually subsided, significantly reducing gold's appeal as a "crisis hedge." Investors are turning to riskier assets, and funds are flowing out of gold ETFs and safe-haven asset pools, further limiting the upside potential of gold prices.
The latest US CPI data shows that inflation has slowed to below market expectations, and the core PCE price index has also declined. This has led traders to reassess the Federal Reserve's monetary policy path in 2026: the market's probability of a rate cut in March has fallen from 70% at the beginning of the month to less than 50%, and the expected number of rate cuts for the whole year has also been lowered from 6 to 4. The rise in real interest rate expectations has directly weakened the relative value of gold, a non-interest-bearing asset, becoming the core driving force behind the downward pressure on gold prices.
With the US President's Day holiday and the Asian Lunar New Year holidays, trading volumes at major global gold trading centers (New York, London, and Shanghai) declined significantly. In this sluggish trading environment, even small, large orders could trigger sharp price fluctuations, allowing short sellers to take advantage of the situation and amplify the decline in gold prices.
Technical Breakout: From "Bull Trap" to Trend Rebalancing
In our analysis of gold price trends on February 9th, we pointed out:
(Spot gold 1-hour chart source: EasyForex)
The long-term upward trend has been confirmed to remain valid.
After the extreme volatility surge at the beginning of the month, the market is likely to enter a phase of re-finding equilibrium.
Gold price volatility is expected to narrow, and the balance between bulls and bears may be reached around the psychological level of $5,000.
Indeed, from February 9th to 12th, gold prices formed a consolidation range above $5,000, specifically between the resistance level R1 (approximately $5,100) and the local support level S1 (approximately $5,000).
The arrow in the chart indicates a false upward breakout: gold prices briefly surged above R1 before quickly falling back, failing to hold the key resistance level. This suggests that the bulls were unable to maintain the upward momentum, instead forming a "bull trap." This movement exposed the exhaustion of bullish momentum, giving the bears an opportunity to regain control.
After gold prices decisively broke below the S1 support level ($5000), this level quickly transformed into the resistance level R2. This is clearly evident from today's downward trend:
The bears remain in control, and gold prices have broken below the local support level S2 (approximately $4,900).
The short-term moving averages have formed a death cross, and the MACD histogram continues to expand, indicating a clear bearish signal from a technical perspective.
The key support level for the bulls lies at the lower trendline of the long-term upward channel (around $4850). Since February, gold prices have twice fallen back into the long-term upward channel, and it is highly likely that they will continue to trade within the channel. It is worth noting that if gold prices strongly break through the yellow resistance line in the chart (around $5050), it can be considered a bullish flag pattern breakout, and the bulls are expected to restart their upward trend, challenging the previous high of $5200.
Market Outlook: Focus on Two Key Variables
In the short term, gold prices will depend on two key variables:
Federal Reserve policy signals: If subsequent employment or inflation data exceed expectations again, market bets on interest rate cuts may cool further, and gold prices may test the lower support level of the channel.
Geopolitical risks are recurring: If the situation in the Middle East or Eastern Europe escalates again, safe-haven demand may return quickly, and gold is expected to rebound based on the lower rail of the channel.
In the medium term, as long as the long-term upward channel is not effectively broken, the bullish tone for gold remains unchanged. Investors need to closely monitor the support level of the lower channel line and the battle between bulls and bears at the $5,000 mark, as these will be the key watershed for determining whether gold enters a deep correction or resumes its upward trend.
- Risk Warning and Disclaimer
- The market involves risk, and trading may not be suitable for all investors. This article is for reference only and does not constitute personal investment advice, nor does it take into account certain users’ specific investment objectives, financial situation, or other needs. Any investment decisions made based on this information are at your own risk.