Fear, but not panic! Gold is trapped in a psychological maze of 5000; who will break the deadlock?
2026-02-20 11:36:07
On Friday (February 20) during the Asian session, spot gold traded in a narrow range around $5,000 per ounce. Over the past five trading days, gold's average daily volatility has been close to 3%, a significant decrease from the previous weekly volatility of over 8%. Currently, the market lacks a clear dominant direction, and a wait-and-see attitude has become a key characteristic of the market.
This consolidation pattern stems partly from the lack of a strong rebound in safe-haven demand, while confidence indicators remain relatively stable. Furthermore, the market continues to focus on alternative assets such as US Treasury bonds and the outlook for the Federal Reserve's monetary policy. Currently, given the lack of significant fundamental catalysts, hesitation is likely to be the dominant factor in near-term gold trading.

The latest minutes of the Federal Reserve meeting released on Wednesday showed that policymakers acknowledged progress in inflation, but noted that it was still insufficient to quickly reach the 2.00% target. This suggests that the Fed is in no hurry to implement aggressive interest rate cuts in the short term.
The minutes also noted that the strong momentum of economic activity could generate persistent and unmanageable inflationary pressures. Therefore, the central bank maintained a neutral stance rather than signaling a significant and immediate start to a rate-cutting cycle.
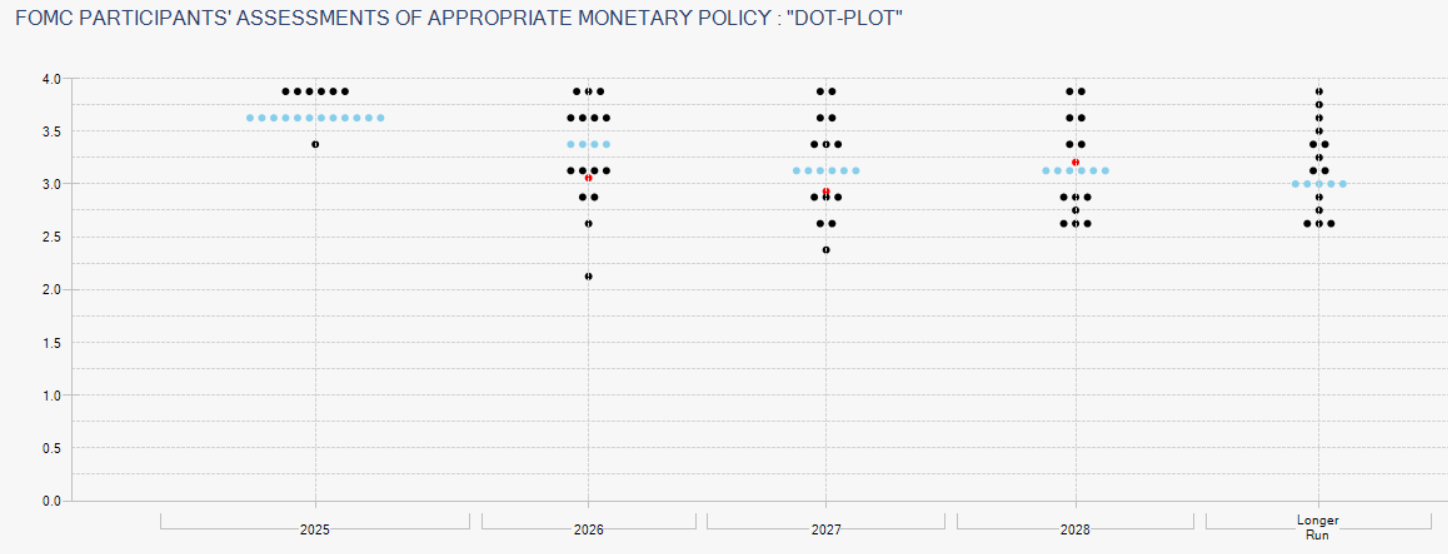
This outlook is reflected in the CME Group's "dot plot," where the median forecast from Federal Reserve members points to interest rates falling below 3.5% later this year, implying gradual rate cuts. However, many forecasts remain focused around the 3.75% level, highlighting a lack of consensus on the pace of future adjustments, suggesting that any rate cuts in the coming months are likely to be implemented slowly .
This neutral environment has also impacted the US bond market. The 10-year Treasury yield, which had been hovering around 4.00% recently, has rebounded slightly, moving away from its three-month low of 4.02%, reflecting the renewed attractiveness of fixed-income assets following the release of the Federal Reserve meeting minutes.
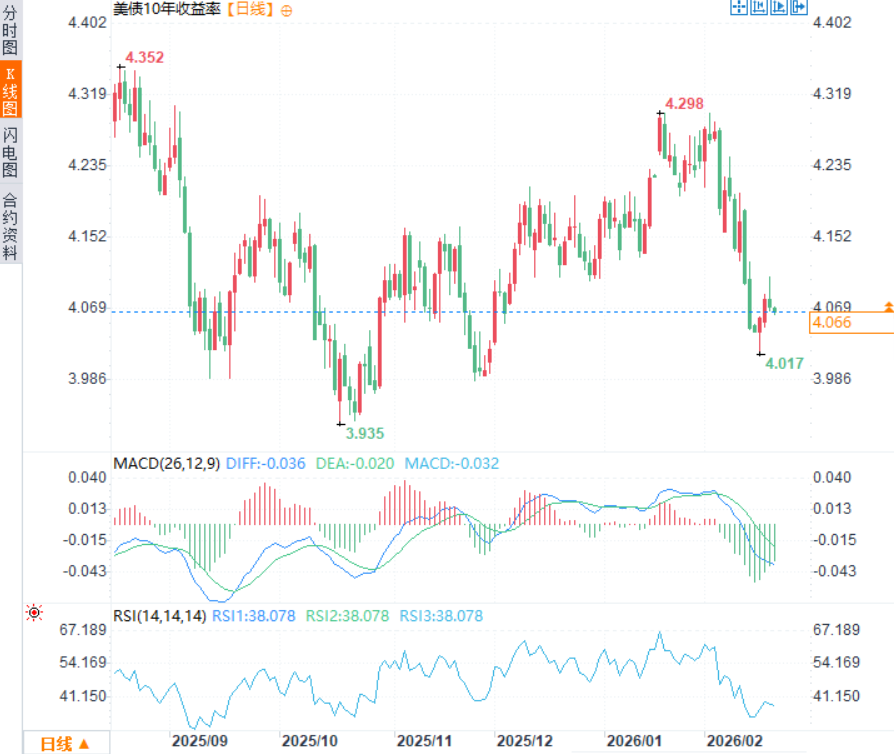
(Daily chart of 10-year US Treasury yield, source: EasyTrade)
This is particularly important for gold, as US Treasuries serve as an alternative within the safe-haven asset category. A rise in bond yields could diminish gold's relative appeal and limit capital inflows. In this sense, the Fed's neutral stance may not support a sustained rise in gold prices; instead, it could lead to continued hesitation in gold demand in the near term.
Gold, as a traditional safe-haven asset, typically benefits when market confidence deteriorates significantly. Currently, the Fear & Greed Index is hovering around 38 points, within the "fear" zone, but there has been no further meaningful deterioration in recent trading days.
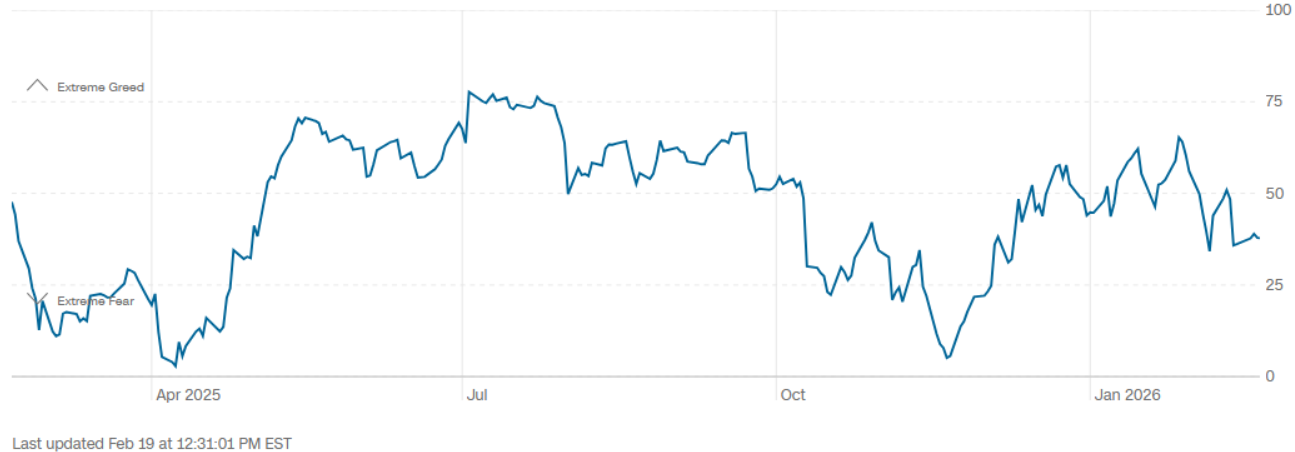
While market sentiment remains cautious, the recent stability of this index suggests that no new round of uncertainty has emerged to trigger sustained safe-haven demand. Unless a significantly lower figure emerges to reflect deeper pessimism, gold is likely to continue its hesitant price movement in the short term .
The upward trend is showing signs of stalling: Although gold has maintained a solid upward trendline in recent months, a growing neutral stance has emerged in recent weeks. Gold prices have entered a consolidation phase, which could weaken the momentum of the previous bullish move and, if this phase continues, could even jeopardize the current upward trend.
RSI: The Relative Strength Index (RSI) reflects this neutral stance. The indicator is currently oscillating around the 50 level, suggesting a balance of power between buyers and sellers in the short term. If this pattern continues, this period of indecision may persist in the coming trading days.
Key observation level:
$5,500 – Key Resistance Level: This is a psychological level close to historical highs. Continued price movement towards this level could reactivate dominant buying pressure and extend the current bullish structure.
$5100 – Near-term resistance: A recent resistance level that has resulted in a significantly neutral price action. Unless gold prices decisively break out of this level, the short-term consolidation range is likely to continue.
$4700 – Key Support Level: A confluence of support levels coinciding with the recent low, the major uptrend line, and the 50-period moving average (MA, 4703.09). A break below this level would jeopardize the current bullish structure and could potentially lead to a more dominant bearish bias in the short term.
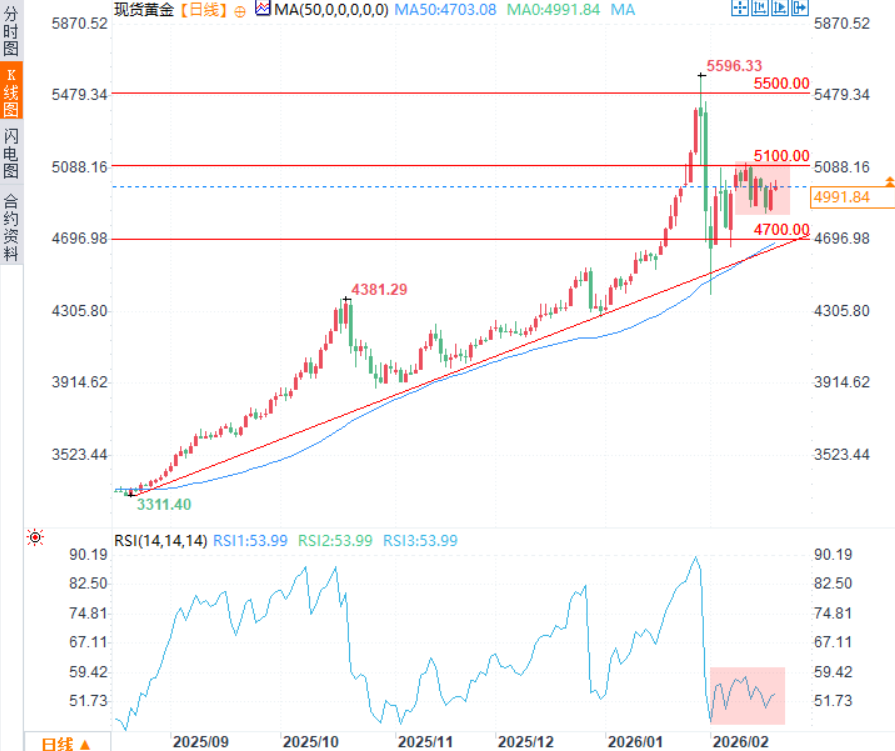
(Spot gold daily chart, source: FX678)
At 11:33 Beijing time, spot gold was trading at $4,996.68 per ounce.
This consolidation pattern stems partly from the lack of a strong rebound in safe-haven demand, while confidence indicators remain relatively stable. Furthermore, the market continues to focus on alternative assets such as US Treasury bonds and the outlook for the Federal Reserve's monetary policy. Currently, given the lack of significant fundamental catalysts, hesitation is likely to be the dominant factor in near-term gold trading.
Forward Outlook for the Federal Reserve
The latest minutes of the Federal Reserve meeting released on Wednesday showed that policymakers acknowledged progress in inflation, but noted that it was still insufficient to quickly reach the 2.00% target. This suggests that the Fed is in no hurry to implement aggressive interest rate cuts in the short term.
The minutes also noted that the strong momentum of economic activity could generate persistent and unmanageable inflationary pressures. Therefore, the central bank maintained a neutral stance rather than signaling a significant and immediate start to a rate-cutting cycle.
This outlook is reflected in the CME Group's "dot plot," where the median forecast from Federal Reserve members points to interest rates falling below 3.5% later this year, implying gradual rate cuts. However, many forecasts remain focused around the 3.75% level, highlighting a lack of consensus on the pace of future adjustments, suggesting that any rate cuts in the coming months are likely to be implemented slowly .
This neutral environment has also impacted the US bond market. The 10-year Treasury yield, which had been hovering around 4.00% recently, has rebounded slightly, moving away from its three-month low of 4.02%, reflecting the renewed attractiveness of fixed-income assets following the release of the Federal Reserve meeting minutes.
(Daily chart of 10-year US Treasury yield, source: EasyTrade)
This is particularly important for gold, as US Treasuries serve as an alternative within the safe-haven asset category. A rise in bond yields could diminish gold's relative appeal and limit capital inflows. In this sense, the Fed's neutral stance may not support a sustained rise in gold prices; instead, it could lead to continued hesitation in gold demand in the near term.
The confidence index showed no significant change.
Gold, as a traditional safe-haven asset, typically benefits when market confidence deteriorates significantly. Currently, the Fear & Greed Index is hovering around 38 points, within the "fear" zone, but there has been no further meaningful deterioration in recent trading days.
While market sentiment remains cautious, the recent stability of this index suggests that no new round of uncertainty has emerged to trigger sustained safe-haven demand. Unless a significantly lower figure emerges to reflect deeper pessimism, gold is likely to continue its hesitant price movement in the short term .
Technical Analysis
The upward trend is showing signs of stalling: Although gold has maintained a solid upward trendline in recent months, a growing neutral stance has emerged in recent weeks. Gold prices have entered a consolidation phase, which could weaken the momentum of the previous bullish move and, if this phase continues, could even jeopardize the current upward trend.
RSI: The Relative Strength Index (RSI) reflects this neutral stance. The indicator is currently oscillating around the 50 level, suggesting a balance of power between buyers and sellers in the short term. If this pattern continues, this period of indecision may persist in the coming trading days.
Key observation level:
$5,500 – Key Resistance Level: This is a psychological level close to historical highs. Continued price movement towards this level could reactivate dominant buying pressure and extend the current bullish structure.
$5100 – Near-term resistance: A recent resistance level that has resulted in a significantly neutral price action. Unless gold prices decisively break out of this level, the short-term consolidation range is likely to continue.
$4700 – Key Support Level: A confluence of support levels coinciding with the recent low, the major uptrend line, and the 50-period moving average (MA, 4703.09). A break below this level would jeopardize the current bullish structure and could potentially lead to a more dominant bearish bias in the short term.
(Spot gold daily chart, source: FX678)
At 11:33 Beijing time, spot gold was trading at $4,996.68 per ounce.
- Risk Warning and Disclaimer
- The market involves risk, and trading may not be suitable for all investors. This article is for reference only and does not constitute personal investment advice, nor does it take into account certain users’ specific investment objectives, financial situation, or other needs. Any investment decisions made based on this information are at your own risk.