Despite heightened geopolitical risks, yields remain stagnant. What is the US Treasury market truly afraid of?
2026-02-20 19:39:16
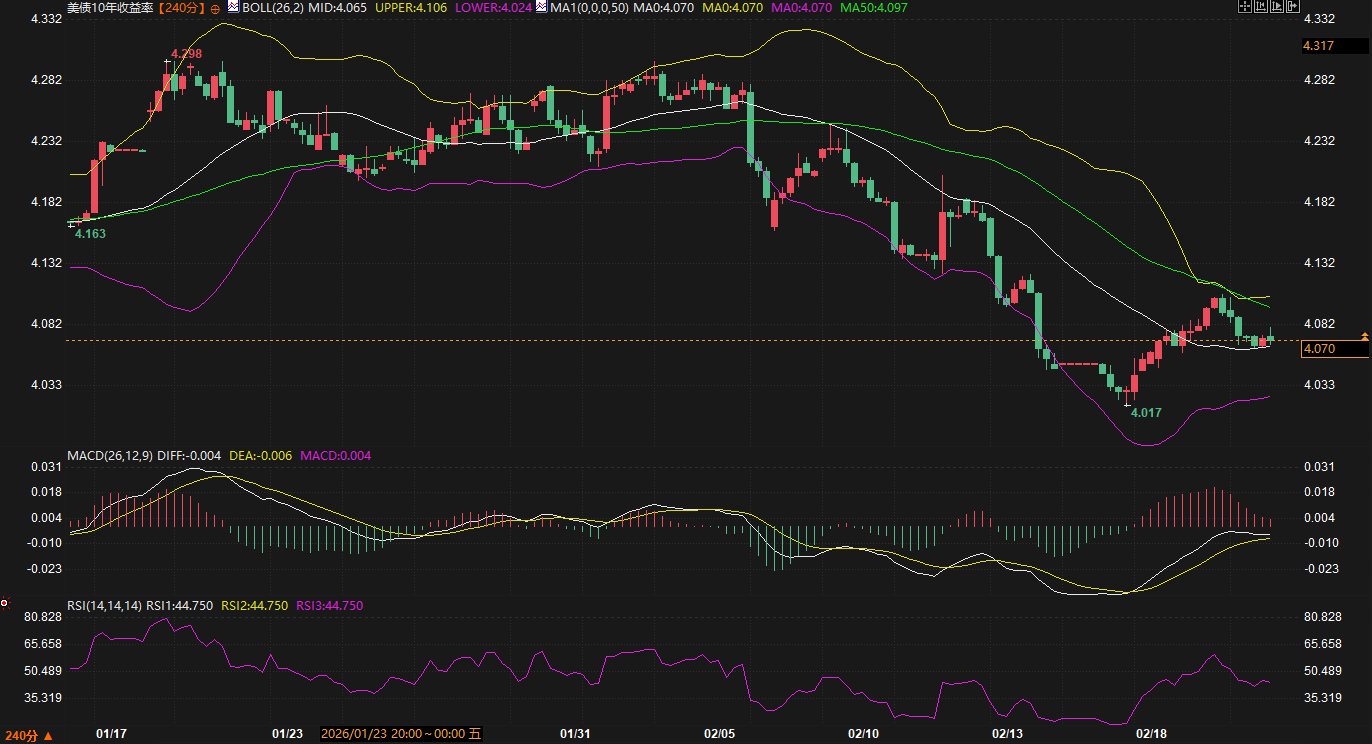
On Friday (February 20), the US Treasury market remained largely stable overnight, with the 10-year yield fluctuating narrowly around 4.07%. Although geopolitical tensions (especially the escalating US-Iran standoff) briefly triggered safe-haven buying, the market's technical rebound, after a nearly 30 basis point drop, encountered resistance from the medium-term moving average. The 240-minute chart shows that the yield formed a "hammer" candlestick pattern after hitting a low of 4.017%, and is currently testing the 4.065% support level of the Bollinger Bands' middle line. This article will analyze the logic behind the market's balance between bulls and bears, starting with the latest fundamental changes and combining them with key technical levels, and will project a short-term trend based on the 240-minute chart.

Entering late February, the dominant factors in the US Treasury market exhibited a clear multifaceted interplay. Overnight news revealed that escalating geopolitical risks became a significant force supporting the bond market. The Wall Street Journal and the Financial Times extensively reported on the US military deployment against Iran, and the Trump administration issued a 15-day ultimatum to Iran, demanding an agreement or "bad things will happen." These developments propelled oil prices to their first weekly rise in three weeks, while also attracting some safe-haven funds into the US Treasury market.
However, it's worth noting that the market's reaction to geopolitical risks has been relatively restrained. IFR's overnight summary explicitly pointed out that despite frequent reports of an impending US strike on Iran, initial selling pressure initially outweighed safe-haven buying. Behind this phenomenon is the market's repricing of the Federal Reserve's policy path. The latest FOMC meeting minutes show that officials have "very little" willingness to cut interest rates, with some even advocating for more neutral wording, describing the prospects for rate hikes and cuts as "balanced." More importantly, Federal Reserve Governor Miran's stance has shifted significantly, acknowledging that recent economic data has been stronger than expected, which will likely lead him to reverse his December policy move. Renowned economist Nick Timiraos interprets this as follows: the data released after the January meeting (especially the record-breaking price increase in three years for commodities excluding food, energy, and used cars) will only further solidify the resolve of officials who are not in a hurry to cut rates further.
The evolution of inflation expectations is becoming a key focus for the market. Thursday's 30-year TIPS auction recorded record end-user demand, with indirect and direct bidders achieving a combined allocation of 97.5%, and a bid-to-cover ratio of 2.75, well above average. This strong demand indicates that despite recent declines in nominal yields, demand for inflation protection from long-term funds is surging, driven by concerns about the potential transmission of tariff policies to consumer prices. The commodity price component of the December core PCE report already shows that the impact of tariffs is being more broadly reflected in shelf prices.
Combining fundamental signals with market sentiment, the current 10-year US Treasury yield is at a critical technical juncture. The 240-minute chart shows the market has completed a full cycle of rises and falls: the upward movement from mid-January to early February peaked at 4.308%, followed by a sharp drop below the MA50 (4.097%) support level; the market accelerated its decline from February 5th to 13th, reaching a low of 4.017%; and since February 13th, the market has entered a phase of stabilization and rebound.
Key patterns and technical indicators analysis:
The low of 4.017% on February 13th formed a typical "hammer" candlestick pattern, with a long lower shadow and a small body. This is usually considered a short-term bottom signal, and the subsequent price stabilization and rebound validated the effectiveness of this pattern. The current key focus is on the interaction between price and the moving average system:
1. Short-term moving averages converge: The 10-day, 20-day, and 30-day moving averages (MA10, MA20, and MA30) are all converging at 4.070%. This convergence usually indicates that short-term holding costs are becoming more consistent, and the market is choosing a direction. The current price (4.070%) is located precisely in this convergence area, suggesting that the bulls and bears are in a temporary balance.
2. Mid-term moving average resistance: The 50-day moving average (MA50) is at 4.097%, a key level for judging the strength of the mid-term trend. After the price broke below this moving average in early February, it has become a significant resistance level. The current rebound is facing resistance from this moving average.
3. Bollinger Bands: After rebounding from the lower band at 4.024%, the price has now risen back to around the middle band at 4.065%. The middle band acts as a dynamic equilibrium line; if it can hold above this level, the rebound is expected to extend to the upper band at 4.106%. Conversely, if it falls below this level again, it indicates a weak rebound.
4. Momentum Indicators: The MACD's DIFF and DEA lines are converging below the zero line. Although the histogram has turned slightly positive (0.004), the momentum is extremely weak, indicating that the bulls do not yet have the momentum to initiate a trend. The RSI is at 44.75, in the neutral to weak zone, neither oversold nor returning to the strong zone above 50.
Based on the technical structure presented in the 240-minute chart, and combined with current fundamental drivers, the US Treasury yield trend in the next few trading days may unfold in the following two scenarios:
Scenario 1 (Slightly Bullish with Fluctuations): Holding Above the Middle Bollinger Band, Testing the MA50 Resistance <br />If geopolitical tensions continue to escalate, or if the upcoming PCE inflation data (tonight at 21:30 Beijing time) fails to show an unexpectedly high increase, yields may continue to be supported by risk aversion. Technically, it is necessary to observe whether the price can effectively hold above the Bollinger Band middle line at 4.065%. If support is found at this level, the rebound is expected to continue, with the first target at 4.097% where the MA50 is located, and strong resistance at the upper Bollinger Band at 4.106%. In this scenario, the MACD histogram needs to continue to expand, and the RSI needs to rise above 50 to confirm a shift in momentum.
Scenario 2 (Rebound Fails): Return to Mid-Term Correction <br/>If today's released US Q4 GDP revision, December PCE data, or February University of Michigan inflation forecast final reading unexpectedly rise, reinforcing expectations that the Fed will postpone interest rate cuts, the current weak rebound may end at any time. Given that short-term moving averages are highly converged, a break below the 4.060%-4.065% support zone could trigger technical selling, with the next support level retesting the February 13 low of 4.017%. If this level is breached, the downside potential will further open to below the psychological level of 4.000%.
The market is currently in a typical "data waiting period." Technical indicators suggest that bulls and bears are on the verge of equilibrium, while fundamentals face a tug-of-war between geopolitical risks (positive for the bond market) and persistent inflation (negative for the bond market). The convergence of moving averages on the 240-minute chart indicates an imminent breakout, and the direction of this breakout will heavily depend on tonight's US economic data and its impact on expectations for Federal Reserve policy. Given the market's recent high sensitivity to inflation data, any unexpected reading could disrupt the current fragile equilibrium and drive yields in a certain direction.
Fundamental Overview: The Interplay Between Geopolitical Risks and Inflation Expectations
Entering late February, the dominant factors in the US Treasury market exhibited a clear multifaceted interplay. Overnight news revealed that escalating geopolitical risks became a significant force supporting the bond market. The Wall Street Journal and the Financial Times extensively reported on the US military deployment against Iran, and the Trump administration issued a 15-day ultimatum to Iran, demanding an agreement or "bad things will happen." These developments propelled oil prices to their first weekly rise in three weeks, while also attracting some safe-haven funds into the US Treasury market.
However, it's worth noting that the market's reaction to geopolitical risks has been relatively restrained. IFR's overnight summary explicitly pointed out that despite frequent reports of an impending US strike on Iran, initial selling pressure initially outweighed safe-haven buying. Behind this phenomenon is the market's repricing of the Federal Reserve's policy path. The latest FOMC meeting minutes show that officials have "very little" willingness to cut interest rates, with some even advocating for more neutral wording, describing the prospects for rate hikes and cuts as "balanced." More importantly, Federal Reserve Governor Miran's stance has shifted significantly, acknowledging that recent economic data has been stronger than expected, which will likely lead him to reverse his December policy move. Renowned economist Nick Timiraos interprets this as follows: the data released after the January meeting (especially the record-breaking price increase in three years for commodities excluding food, energy, and used cars) will only further solidify the resolve of officials who are not in a hurry to cut rates further.
The evolution of inflation expectations is becoming a key focus for the market. Thursday's 30-year TIPS auction recorded record end-user demand, with indirect and direct bidders achieving a combined allocation of 97.5%, and a bid-to-cover ratio of 2.75, well above average. This strong demand indicates that despite recent declines in nominal yields, demand for inflation protection from long-term funds is surging, driven by concerns about the potential transmission of tariff policies to consumer prices. The commodity price component of the December core PCE report already shows that the impact of tariffs is being more broadly reflected in shelf prices.
Technical Analysis: The rebound encountered resistance from the moving average, and a critical point between bulls and bears has emerged.
Combining fundamental signals with market sentiment, the current 10-year US Treasury yield is at a critical technical juncture. The 240-minute chart shows the market has completed a full cycle of rises and falls: the upward movement from mid-January to early February peaked at 4.308%, followed by a sharp drop below the MA50 (4.097%) support level; the market accelerated its decline from February 5th to 13th, reaching a low of 4.017%; and since February 13th, the market has entered a phase of stabilization and rebound.
Key patterns and technical indicators analysis:
The low of 4.017% on February 13th formed a typical "hammer" candlestick pattern, with a long lower shadow and a small body. This is usually considered a short-term bottom signal, and the subsequent price stabilization and rebound validated the effectiveness of this pattern. The current key focus is on the interaction between price and the moving average system:
1. Short-term moving averages converge: The 10-day, 20-day, and 30-day moving averages (MA10, MA20, and MA30) are all converging at 4.070%. This convergence usually indicates that short-term holding costs are becoming more consistent, and the market is choosing a direction. The current price (4.070%) is located precisely in this convergence area, suggesting that the bulls and bears are in a temporary balance.
2. Mid-term moving average resistance: The 50-day moving average (MA50) is at 4.097%, a key level for judging the strength of the mid-term trend. After the price broke below this moving average in early February, it has become a significant resistance level. The current rebound is facing resistance from this moving average.
3. Bollinger Bands: After rebounding from the lower band at 4.024%, the price has now risen back to around the middle band at 4.065%. The middle band acts as a dynamic equilibrium line; if it can hold above this level, the rebound is expected to extend to the upper band at 4.106%. Conversely, if it falls below this level again, it indicates a weak rebound.
4. Momentum Indicators: The MACD's DIFF and DEA lines are converging below the zero line. Although the histogram has turned slightly positive (0.004), the momentum is extremely weak, indicating that the bulls do not yet have the momentum to initiate a trend. The RSI is at 44.75, in the neutral to weak zone, neither oversold nor returning to the strong zone above 50.
Short-term outlook: Probability scenarios within a 240-minute chart framework
Based on the technical structure presented in the 240-minute chart, and combined with current fundamental drivers, the US Treasury yield trend in the next few trading days may unfold in the following two scenarios:
Scenario 1 (Slightly Bullish with Fluctuations): Holding Above the Middle Bollinger Band, Testing the MA50 Resistance <br />If geopolitical tensions continue to escalate, or if the upcoming PCE inflation data (tonight at 21:30 Beijing time) fails to show an unexpectedly high increase, yields may continue to be supported by risk aversion. Technically, it is necessary to observe whether the price can effectively hold above the Bollinger Band middle line at 4.065%. If support is found at this level, the rebound is expected to continue, with the first target at 4.097% where the MA50 is located, and strong resistance at the upper Bollinger Band at 4.106%. In this scenario, the MACD histogram needs to continue to expand, and the RSI needs to rise above 50 to confirm a shift in momentum.
Scenario 2 (Rebound Fails): Return to Mid-Term Correction <br/>If today's released US Q4 GDP revision, December PCE data, or February University of Michigan inflation forecast final reading unexpectedly rise, reinforcing expectations that the Fed will postpone interest rate cuts, the current weak rebound may end at any time. Given that short-term moving averages are highly converged, a break below the 4.060%-4.065% support zone could trigger technical selling, with the next support level retesting the February 13 low of 4.017%. If this level is breached, the downside potential will further open to below the psychological level of 4.000%.
The market is currently in a typical "data waiting period." Technical indicators suggest that bulls and bears are on the verge of equilibrium, while fundamentals face a tug-of-war between geopolitical risks (positive for the bond market) and persistent inflation (negative for the bond market). The convergence of moving averages on the 240-minute chart indicates an imminent breakout, and the direction of this breakout will heavily depend on tonight's US economic data and its impact on expectations for Federal Reserve policy. Given the market's recent high sensitivity to inflation data, any unexpected reading could disrupt the current fragile equilibrium and drive yields in a certain direction.
- Risk Warning and Disclaimer
- The market involves risk, and trading may not be suitable for all investors. This article is for reference only and does not constitute personal investment advice, nor does it take into account certain users’ specific investment objectives, financial situation, or other needs. Any investment decisions made based on this information are at your own risk.