Oil prices surged and then retreated: a shooting star pattern emerged, prompting the market to reassess Middle East risks.
2026-03-09 19:51:27
The international crude oil market has experienced a rare period of extreme volatility in the past few days. Influenced by the escalation of US and Israeli military action against Iran and disruptions to shipping in the Strait of Hormuz, market risk premiums rose rapidly, pushing oil prices sharply higher in a short period. WTI crude oil futures surged from their previous range of around $80-90, reaching a high of $119.48, a new high since 2022; Brent crude oil simultaneously climbed above $119.
However, this rapid rise did not last long. As some funds took profits and the market reassessed the actual extent of the supply shock, oil prices quickly fell from their highs. Currently, WTI has fallen back to around $103, while Brent crude is fluctuating between $105 and $106, down about 15% from its peak. Overall, this round of gains appears to be more of an emotional rally triggered by geopolitical risks, rather than a fundamental change in supply and demand fundamentals.
I. Risk premium widened rapidly: the market was once priced in the "worst-case scenario".
During the peak of conflict news, the market priced in almost all the most extreme supply risks at once, including scenarios such as a prolonged blockade of the Strait of Hormuz and a large-scale disruption of Middle Eastern crude oil exports.
However, judging from the current situation, although shipping has been disrupted, it is still significantly different from a complete shutdown. As the market gradually reassesses the true impact, the initial panic pricing has begun to ease.
From a technical perspective, oil prices have entered a clearly overbought state in the short term. The RSI has risen rapidly to extreme levels, and the MACD momentum has expanded sharply. This type of movement typically occurs in sentiment-driven markets. In fact, historical experience shows that similar geopolitical shocks often lead to short-term surges, but prices tend to give back a significant portion of those gains within days or weeks. A similar pattern was observed in oil prices at the beginning of the Russia-Ukraine conflict in 2022.
II. Policy Signals and Trade Adjustments to Buffer Supply Shocks
While the market is focused on the escalation of the conflict, some buffering factors are gradually emerging.
First, there are the policy signals released by the United States. Trump has repeatedly stated recently that the current rise in oil prices is a "short-term price to pay for security," and hinted that the US might end military operations at an appropriate time if the Iranian nuclear threat is weakened. The White House has also described the current situation as "short-term disturbances in exchange for long-term stability." This statement provides the market with a possible exit path; once signs of easing emerge, the geopolitical risk premium could quickly decline.
Secondly, there is the self-regulating capacity of the global trading system. The United States has granted India a 30-day temporary exemption, allowing it to continue importing already loaded Russian crude oil to mitigate supply risks from disruptions to the Strait of Hormuz. As one of the world's major crude oil importers, India has recently significantly increased its purchases of Russian crude oil, while Russian shipping fleets are also readjusting their shipping arrangements. The rapid activation of alternative supply channels means that the previously feared scenario of a "sharp reduction in global supply" has not actually occurred.
III. Technical Signals: Exhaustion Gap and Daily "Shooting Star" Pattern
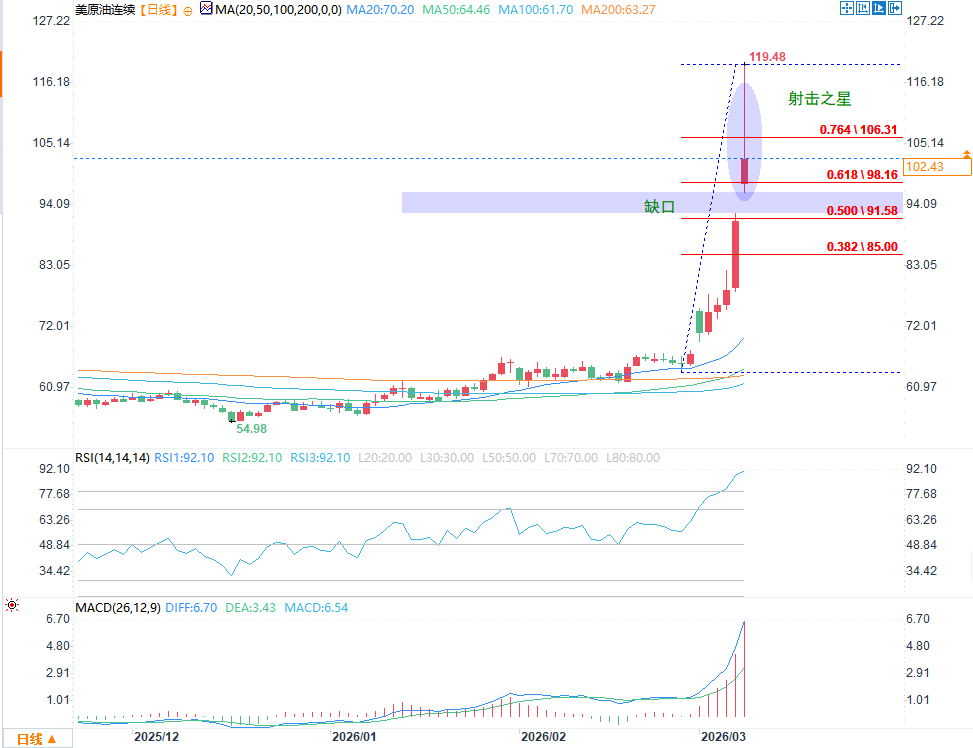
(WTI crude oil daily chart source: FX678)
From a chart perspective, this upward move has left a clear gap, which closely resembles a typical exhaustion gap. Such gaps often appear at the end of a trend and are accompanied by a significant increase in trading volume. Once sentiment begins to decline, prices typically fill the gap quickly.
More notably, when WTI touched around $119, a clear "Shooting Star" pattern appeared on the daily chart—a long upper shadow paired with a relatively small body, indicating a significant weakening of buying momentum at higher levels, while selling pressure began to emerge. This pattern is generally considered one of the short-term top signals.
Under this technical structure, if new catalysts emerge to cool prices, such as the resumption of shipping or progress in diplomatic negotiations, oil prices are likely to first fall back to the $100-$98 range and then further test the important support level around $90.
IV. Long-term fundamentals: Supply and demand surplus will remain the main theme in 2026.
From a longer-term fundamental perspective, the supply and demand structure of the global oil market has not fundamentally changed. Many institutions still predict that supply growth will outpace demand growth in 2026.
The International Energy Agency (IEA) previously projected that global crude oil supply growth this year could reach approximately 2.4 million to 2.5 million barrels per day, while demand growth would be only around 900,000 barrels per day. The increased production will primarily come from non-OPEC+ countries such as the United States, Brazil, and Guyana.
The U.S. Energy Information Administration (EIA) also noted in its latest outlook that, against the backdrop of supply growth and inventory accumulation, oil prices may gradually return to a lower equilibrium range in the coming years. JPMorgan Chase, meanwhile, predicts that the average price of Brent crude oil in 2026 may be around $60.
Under such a fundamental framework, even if geopolitical conflicts drive up prices in the short term, this risk premium is usually difficult to sustain in the long term.
V. Market Outlook: Price Rebalancing After Sentiment Subsides
Considering both fundamental and technical factors, this round of oil price surge appears to be a typical example of sentiment-driven trading. As the market gradually reassesses the impact of supply, policy signals, and alternative supply capabilities, oil prices may gradually return to a range closer to fundamentals.
In the short term, if sentiment continues to cool, oil prices may first fill the gap and fall back to around $100, before finding a new equilibrium in the $90 area. In the medium term, once the conflict shows signs of easing, the geopolitical risk premium may further diminish.
For traders, caution is especially important in the current highly volatile environment. The risks of chasing high prices have increased significantly, and shorting also requires waiting for trend confirmation. Market sentiment often changes rapidly, but in the longer term, oil prices will eventually return to the gravitational pull of supply and demand fundamentals.
However, this rapid rise did not last long. As some funds took profits and the market reassessed the actual extent of the supply shock, oil prices quickly fell from their highs. Currently, WTI has fallen back to around $103, while Brent crude is fluctuating between $105 and $106, down about 15% from its peak. Overall, this round of gains appears to be more of an emotional rally triggered by geopolitical risks, rather than a fundamental change in supply and demand fundamentals.
I. Risk premium widened rapidly: the market was once priced in the "worst-case scenario".
During the peak of conflict news, the market priced in almost all the most extreme supply risks at once, including scenarios such as a prolonged blockade of the Strait of Hormuz and a large-scale disruption of Middle Eastern crude oil exports.
However, judging from the current situation, although shipping has been disrupted, it is still significantly different from a complete shutdown. As the market gradually reassesses the true impact, the initial panic pricing has begun to ease.
From a technical perspective, oil prices have entered a clearly overbought state in the short term. The RSI has risen rapidly to extreme levels, and the MACD momentum has expanded sharply. This type of movement typically occurs in sentiment-driven markets. In fact, historical experience shows that similar geopolitical shocks often lead to short-term surges, but prices tend to give back a significant portion of those gains within days or weeks. A similar pattern was observed in oil prices at the beginning of the Russia-Ukraine conflict in 2022.
II. Policy Signals and Trade Adjustments to Buffer Supply Shocks
While the market is focused on the escalation of the conflict, some buffering factors are gradually emerging.
First, there are the policy signals released by the United States. Trump has repeatedly stated recently that the current rise in oil prices is a "short-term price to pay for security," and hinted that the US might end military operations at an appropriate time if the Iranian nuclear threat is weakened. The White House has also described the current situation as "short-term disturbances in exchange for long-term stability." This statement provides the market with a possible exit path; once signs of easing emerge, the geopolitical risk premium could quickly decline.
Secondly, there is the self-regulating capacity of the global trading system. The United States has granted India a 30-day temporary exemption, allowing it to continue importing already loaded Russian crude oil to mitigate supply risks from disruptions to the Strait of Hormuz. As one of the world's major crude oil importers, India has recently significantly increased its purchases of Russian crude oil, while Russian shipping fleets are also readjusting their shipping arrangements. The rapid activation of alternative supply channels means that the previously feared scenario of a "sharp reduction in global supply" has not actually occurred.
III. Technical Signals: Exhaustion Gap and Daily "Shooting Star" Pattern
(WTI crude oil daily chart source: FX678)
From a chart perspective, this upward move has left a clear gap, which closely resembles a typical exhaustion gap. Such gaps often appear at the end of a trend and are accompanied by a significant increase in trading volume. Once sentiment begins to decline, prices typically fill the gap quickly.
More notably, when WTI touched around $119, a clear "Shooting Star" pattern appeared on the daily chart—a long upper shadow paired with a relatively small body, indicating a significant weakening of buying momentum at higher levels, while selling pressure began to emerge. This pattern is generally considered one of the short-term top signals.
Under this technical structure, if new catalysts emerge to cool prices, such as the resumption of shipping or progress in diplomatic negotiations, oil prices are likely to first fall back to the $100-$98 range and then further test the important support level around $90.
IV. Long-term fundamentals: Supply and demand surplus will remain the main theme in 2026.
From a longer-term fundamental perspective, the supply and demand structure of the global oil market has not fundamentally changed. Many institutions still predict that supply growth will outpace demand growth in 2026.
The International Energy Agency (IEA) previously projected that global crude oil supply growth this year could reach approximately 2.4 million to 2.5 million barrels per day, while demand growth would be only around 900,000 barrels per day. The increased production will primarily come from non-OPEC+ countries such as the United States, Brazil, and Guyana.
The U.S. Energy Information Administration (EIA) also noted in its latest outlook that, against the backdrop of supply growth and inventory accumulation, oil prices may gradually return to a lower equilibrium range in the coming years. JPMorgan Chase, meanwhile, predicts that the average price of Brent crude oil in 2026 may be around $60.
Under such a fundamental framework, even if geopolitical conflicts drive up prices in the short term, this risk premium is usually difficult to sustain in the long term.
V. Market Outlook: Price Rebalancing After Sentiment Subsides
Considering both fundamental and technical factors, this round of oil price surge appears to be a typical example of sentiment-driven trading. As the market gradually reassesses the impact of supply, policy signals, and alternative supply capabilities, oil prices may gradually return to a range closer to fundamentals.
In the short term, if sentiment continues to cool, oil prices may first fill the gap and fall back to around $100, before finding a new equilibrium in the $90 area. In the medium term, once the conflict shows signs of easing, the geopolitical risk premium may further diminish.
For traders, caution is especially important in the current highly volatile environment. The risks of chasing high prices have increased significantly, and shorting also requires waiting for trend confirmation. Market sentiment often changes rapidly, but in the longer term, oil prices will eventually return to the gravitational pull of supply and demand fundamentals.
- Risk Warning and Disclaimer
- The market involves risk, and trading may not be suitable for all investors. This article is for reference only and does not constitute personal investment advice, nor does it take into account certain users’ specific investment objectives, financial situation, or other needs. Any investment decisions made based on this information are at your own risk.