US Dollar Outlook: Seasonal Weakness in April Coupled with Uncertainties in the Middle East
2026-04-01 19:13:20
On Wednesday (April 1), the US dollar faced significant seasonal downward pressure as it entered April. Historical data shows that the dollar generally tends to weaken against major currencies during this period. However, the outlook for this year is far from simple and clear. Geopolitical tensions in the Middle East, high oil prices, and shifts in market expectations for US interest rates could easily disrupt seasonal patterns. Traders must now weigh whether history will repeat itself, or whether macroeconomic and geopolitical forces will dominate market direction.
US Dollar Outlook for April: Seasonal Turn to Bearish, Middle East Risks Looming
Based on monthly data since the beginning of this century, the US dollar index has generally been slightly bullish, with 6 months of gains, 4 months of losses, and 2 months of no change. However, April is a clearly weak month, with both average and median returns trending downwards.
Seasonal patterns in April point to a weaker dollar.
The US dollar index has only a 32% probability of rising in April, and falls 68% of the time; the average return is -0.77%, and the median return is -0.8%.
The fact that the mean and median are very close indicates that the data is relatively stable and not distorted by extreme values, making the 68% probability of decline more meaningful.
In months of decline, the dollar averages a -2% drop, only slightly higher than the average 1.8% gain in months of increase. Geopolitical factors will determine whether seasonal patterns materialize.
Whether the US dollar will follow seasonal trends largely depends on whether the conflict in the Middle East can truly ease. Seasonal patterns reflect the average of historical results and are easily masked by major factors such as geopolitical shocks and economic recessions. If the conflict continues to escalate, or the Strait of Hormuz remains blocked, the US dollar may strengthen against the trend, breaking the seasonal pattern.
Conversely, if the US withdraws its troops and the Strait of Hormuz reopens to navigation, traders may shift their focus back to weak US jobs data and repric expectations of interest rate cuts, as a major source of inflationary pressure will be eliminated. President Trump is scheduled to address the nation Wednesday evening (Thursday morning in Asian trading), and even without specific policy adjustments, markets should be wary of potential volatility. If tensions ease, the upcoming US ISM manufacturing and services data, as well as the non-farm payroll report, will have a far greater impact than currently seen.
Technical Analysis
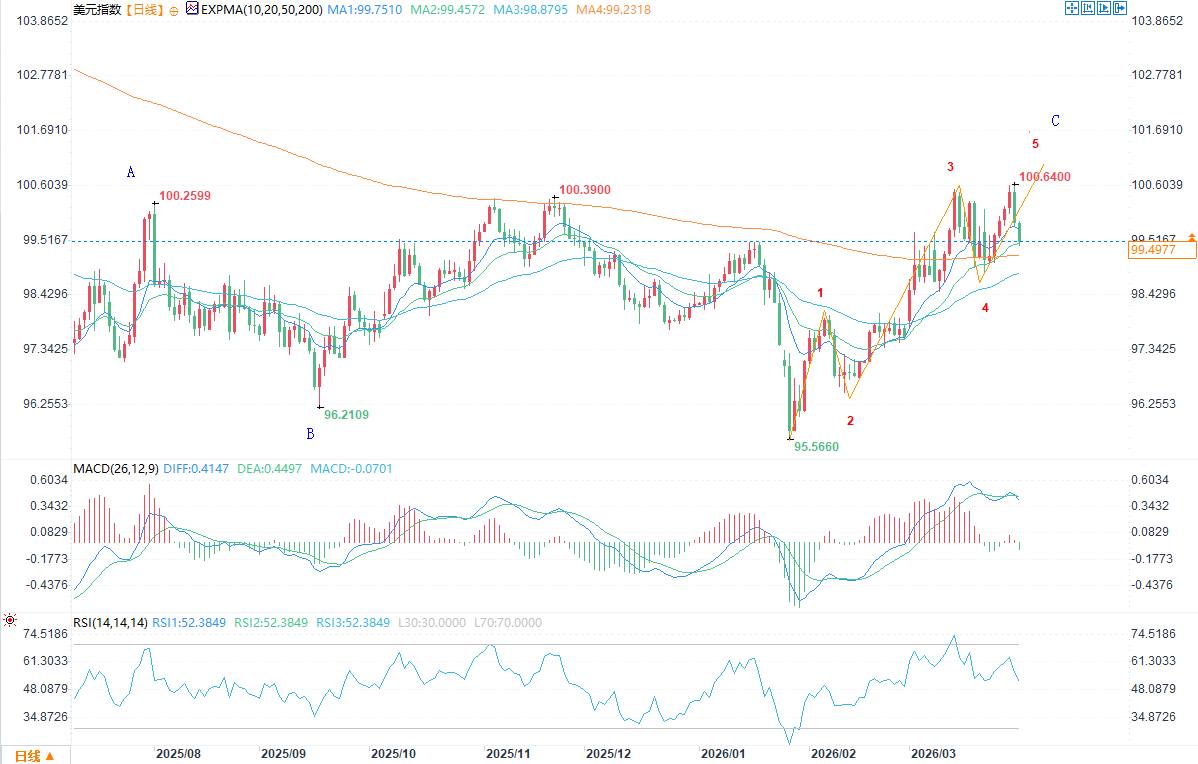
(US Dollar Index Daily Chart Source: FX678)
The US dollar index closed with a bearish engulfing pattern on Tuesday, retreating from its May high. As long as the price holds above the 98.65 low, I maintain my bullish outlook, as this level is likely the end of the fourth wave correction.
Bulls can look for opportunities to buy on pullbacks to support levels, paying attention to stabilization signals at the 20-day moving average (99.46) or the weekly value level (around the 99 mark). The fifth wave is expected to resume its upward trend, targeting 101.50 or the gap resistance level near 102. Ultimately, the author predicts that after the completion of the fifth wave and the larger C wave, the US dollar will form a more significant short-term top.
April Seasonal: Performance of Major Currency Pairs (2000 to Present)
Comparing the performance of the US dollar against major currencies, its bearish bias in April was very evident, with the dollar showing the weakest overall performance. Whether this pattern will continue this year will likely depend on President Trump's speeches and subsequent developments in the Middle East. (Expanded section: approximately 50% more content added; bold text indicates new/expanded content): Generally speaking, the seasonal weakness in April is not a hard and fast rule, but rather a reflection of historical averages. While the US dollar index has indeed tended to be weaker in April over the past two decades, this pattern is often broken in the face of major external shocks. The evolution of the Middle East situation this year will be one of the most critical variables. High oil prices not only push up global inflation expectations but may also strengthen the dollar's appeal as a safe-haven asset, especially when markets are concerned about energy supply disruptions.
Furthermore, a flurry of US domestic economic data releases are imminent. Weak employment and manufacturing indicators would normally reinforce expectations of a Federal Reserve rate cut, further pressuring the dollar; however, if the Middle East conflict keeps oil prices high, inflation risks could force the market to reassess the Fed's policy path, or even postpone the timing of rate cuts, providing unexpected support for the dollar. Traders need to closely monitor the tone of Trump's speeches—any clear signals regarding a troop withdrawal timetable or the reopening of the Strait of Hormuz could trigger significant market volatility.
From a technical perspective, the US dollar index is currently fluctuating around the 99 level. While the short-term bearish engulfing pattern indicates downward pressure, the bullish structure remains intact as long as it doesn't decisively break below the 98.65 support level. If geopolitical risks ease, the dollar may test lower support levels before rebounding; conversely, if conflicts escalate, safe-haven buying could directly push the index to challenge resistance above 100. Overall, the dollar's performance in April will be highly dependent on the interplay of macroeconomic and geopolitical factors. While seasonal patterns provide a framework, actual market movements are more likely to be driven by unforeseen events. Investors should maintain flexible positions and be prepared for potential trend reversals.
US Dollar Outlook for April: Seasonal Turn to Bearish, Middle East Risks Looming
Based on monthly data since the beginning of this century, the US dollar index has generally been slightly bullish, with 6 months of gains, 4 months of losses, and 2 months of no change. However, April is a clearly weak month, with both average and median returns trending downwards.
Seasonal patterns in April point to a weaker dollar.
The US dollar index has only a 32% probability of rising in April, and falls 68% of the time; the average return is -0.77%, and the median return is -0.8%.
The fact that the mean and median are very close indicates that the data is relatively stable and not distorted by extreme values, making the 68% probability of decline more meaningful.
In months of decline, the dollar averages a -2% drop, only slightly higher than the average 1.8% gain in months of increase. Geopolitical factors will determine whether seasonal patterns materialize.
Whether the US dollar will follow seasonal trends largely depends on whether the conflict in the Middle East can truly ease. Seasonal patterns reflect the average of historical results and are easily masked by major factors such as geopolitical shocks and economic recessions. If the conflict continues to escalate, or the Strait of Hormuz remains blocked, the US dollar may strengthen against the trend, breaking the seasonal pattern.
Conversely, if the US withdraws its troops and the Strait of Hormuz reopens to navigation, traders may shift their focus back to weak US jobs data and repric expectations of interest rate cuts, as a major source of inflationary pressure will be eliminated. President Trump is scheduled to address the nation Wednesday evening (Thursday morning in Asian trading), and even without specific policy adjustments, markets should be wary of potential volatility. If tensions ease, the upcoming US ISM manufacturing and services data, as well as the non-farm payroll report, will have a far greater impact than currently seen.
Technical Analysis
(US Dollar Index Daily Chart Source: FX678)
The US dollar index closed with a bearish engulfing pattern on Tuesday, retreating from its May high. As long as the price holds above the 98.65 low, I maintain my bullish outlook, as this level is likely the end of the fourth wave correction.
Bulls can look for opportunities to buy on pullbacks to support levels, paying attention to stabilization signals at the 20-day moving average (99.46) or the weekly value level (around the 99 mark). The fifth wave is expected to resume its upward trend, targeting 101.50 or the gap resistance level near 102. Ultimately, the author predicts that after the completion of the fifth wave and the larger C wave, the US dollar will form a more significant short-term top.
April Seasonal: Performance of Major Currency Pairs (2000 to Present)
Comparing the performance of the US dollar against major currencies, its bearish bias in April was very evident, with the dollar showing the weakest overall performance. Whether this pattern will continue this year will likely depend on President Trump's speeches and subsequent developments in the Middle East. (Expanded section: approximately 50% more content added; bold text indicates new/expanded content): Generally speaking, the seasonal weakness in April is not a hard and fast rule, but rather a reflection of historical averages. While the US dollar index has indeed tended to be weaker in April over the past two decades, this pattern is often broken in the face of major external shocks. The evolution of the Middle East situation this year will be one of the most critical variables. High oil prices not only push up global inflation expectations but may also strengthen the dollar's appeal as a safe-haven asset, especially when markets are concerned about energy supply disruptions.
Furthermore, a flurry of US domestic economic data releases are imminent. Weak employment and manufacturing indicators would normally reinforce expectations of a Federal Reserve rate cut, further pressuring the dollar; however, if the Middle East conflict keeps oil prices high, inflation risks could force the market to reassess the Fed's policy path, or even postpone the timing of rate cuts, providing unexpected support for the dollar. Traders need to closely monitor the tone of Trump's speeches—any clear signals regarding a troop withdrawal timetable or the reopening of the Strait of Hormuz could trigger significant market volatility.
From a technical perspective, the US dollar index is currently fluctuating around the 99 level. While the short-term bearish engulfing pattern indicates downward pressure, the bullish structure remains intact as long as it doesn't decisively break below the 98.65 support level. If geopolitical risks ease, the dollar may test lower support levels before rebounding; conversely, if conflicts escalate, safe-haven buying could directly push the index to challenge resistance above 100. Overall, the dollar's performance in April will be highly dependent on the interplay of macroeconomic and geopolitical factors. While seasonal patterns provide a framework, actual market movements are more likely to be driven by unforeseen events. Investors should maintain flexible positions and be prepared for potential trend reversals.
- Risk Warning and Disclaimer
- The market involves risk, and trading may not be suitable for all investors. This article is for reference only and does not constitute personal investment advice, nor does it take into account certain users’ specific investment objectives, financial situation, or other needs. Any investment decisions made based on this information are at your own risk.