Gold Analysis: Soaring oil prices limit gold's breakout; inflation risks continue to accumulate.
2026-04-07 00:52:02
On Monday (April 6), spot gold edged lower during the midday US session, but remained stable within the price range established last Thursday. This range-bound movement clearly reflects investor hesitation and foreshadows potential for significant volatility. Technically, traders are caught between multiple retracement levels, which support both bullish and bearish views. Fundamentally, bullish investors are closely watching the ongoing ceasefire negotiations, hoping for safe-haven buying due to easing tensions, while bearish investors are concerned about a potential escalation of the conflict between the US and Iran, which could shift market risk appetite and suppress gold's gains.

Technical Outlook
Key oscillators on the daily chart indicate that gold is currently in a downtrend, clearly evidenced by the "lower lows, lower highs" pattern. A break below $4099.12/oz would further confirm the continuation of this downtrend. A minor high of $4800.80/oz has formed; while a break above this level wouldn't change the overall downtrend, it would confirm a recent shift in market momentum to the upside, providing support for a short-term rebound in gold prices.
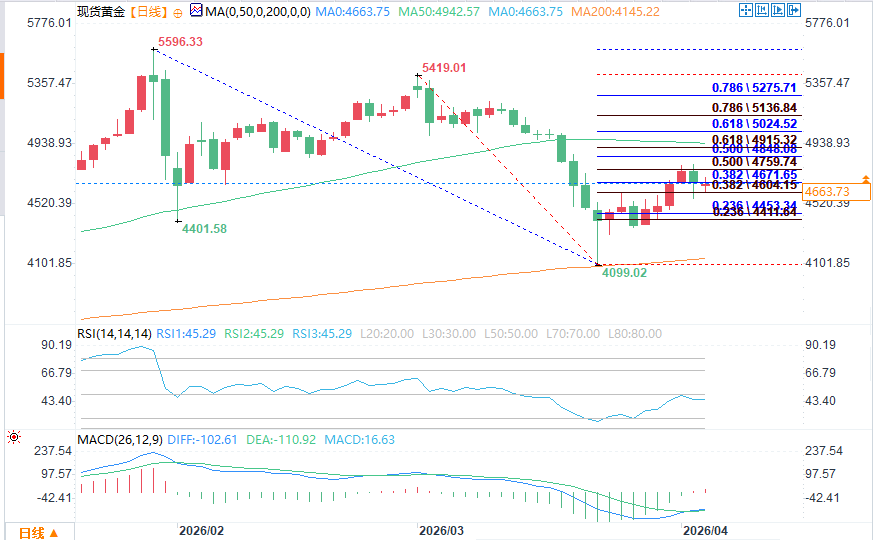
(Spot gold daily chart source: FX678)
Key retracement levels suppressing gold's gains include: the primary 50% retracement level at $4744.34/oz, the secondary 50% retracement level at $4850.68/oz, and the 61.8% retracement level at $5028.04/oz. Potential support levels include the primary 61.8% retracement level at $4541.88/oz, and a secondary support range of $4449.96/oz to $4367.16/oz.
Traders should also note that spot gold is currently trapped between the long-term 200-day moving average ($4,145.71/oz) and the short-term 50-day moving average ($4,943.90/oz). These two moving averages further compress the fluctuation range of gold prices and have become important reference indicators for judging short-term trends.
Despite the oscillator indicating a current downtrend, the recent rebound in gold prices from $4,099.12/oz suggests that traders are still maintaining a "buy on dips" strategy, with the 200-day moving average acting as both support and providing important operational guidance for the market.
In the short term, if gold prices break through $4744.34/oz, they are likely to test $4850.68/oz further, and may subsequently challenge $4944.01/oz and $5028.04/oz. However, given the prevailing market sentiment of buying on dips, shorting is not recommended until gold prices fall below $4541.88/oz.
In summary, we believe that spot gold will likely trade sideways in the short term, with a slight bullish bias. For the bulls, the positive news is that the 50-day moving average is gradually declining, making it easier for gold to break through this level and bringing it closer to a breakout point. Meanwhile, the 200-day moving average is starting to rise slightly, and the range between the two moving averages is narrowing. The narrower the range, the stronger the subsequent breakout is likely to be, and the greater the potential volatility.
The biggest threat currently facing gold: oil prices.
Gold prices were flat on Monday, mainly as traders closely watched war-related headlines and awaited any updates on the Strait of Hormuz. However, the war itself is not the core factor influencing gold; oil prices are the key variable currently constraining its price movement. The longer the conflict lasts, the more likely energy prices are to remain high, further pushing up inflation. High inflation will force the Federal Reserve to maintain current interest rates, making it difficult to initiate a rate-cutting cycle.
This week is packed with economic data releases, including the Federal Reserve meeting minutes, Personal Consumption Expenditures (PCE) data, and the Consumer Price Index (CPI). Current market expectations suggest that a Fed rate cut is unlikely in the short term, a expectation that continues to weigh on gold prices and limit their upside potential.
Technical Outlook
Key oscillators on the daily chart indicate that gold is currently in a downtrend, clearly evidenced by the "lower lows, lower highs" pattern. A break below $4099.12/oz would further confirm the continuation of this downtrend. A minor high of $4800.80/oz has formed; while a break above this level wouldn't change the overall downtrend, it would confirm a recent shift in market momentum to the upside, providing support for a short-term rebound in gold prices.
(Spot gold daily chart source: FX678)
Key retracement levels suppressing gold's gains include: the primary 50% retracement level at $4744.34/oz, the secondary 50% retracement level at $4850.68/oz, and the 61.8% retracement level at $5028.04/oz. Potential support levels include the primary 61.8% retracement level at $4541.88/oz, and a secondary support range of $4449.96/oz to $4367.16/oz.
Traders should also note that spot gold is currently trapped between the long-term 200-day moving average ($4,145.71/oz) and the short-term 50-day moving average ($4,943.90/oz). These two moving averages further compress the fluctuation range of gold prices and have become important reference indicators for judging short-term trends.
Despite the oscillator indicating a current downtrend, the recent rebound in gold prices from $4,099.12/oz suggests that traders are still maintaining a "buy on dips" strategy, with the 200-day moving average acting as both support and providing important operational guidance for the market.
In the short term, if gold prices break through $4744.34/oz, they are likely to test $4850.68/oz further, and may subsequently challenge $4944.01/oz and $5028.04/oz. However, given the prevailing market sentiment of buying on dips, shorting is not recommended until gold prices fall below $4541.88/oz.
In summary, we believe that spot gold will likely trade sideways in the short term, with a slight bullish bias. For the bulls, the positive news is that the 50-day moving average is gradually declining, making it easier for gold to break through this level and bringing it closer to a breakout point. Meanwhile, the 200-day moving average is starting to rise slightly, and the range between the two moving averages is narrowing. The narrower the range, the stronger the subsequent breakout is likely to be, and the greater the potential volatility.
The biggest threat currently facing gold: oil prices.
Gold prices were flat on Monday, mainly as traders closely watched war-related headlines and awaited any updates on the Strait of Hormuz. However, the war itself is not the core factor influencing gold; oil prices are the key variable currently constraining its price movement. The longer the conflict lasts, the more likely energy prices are to remain high, further pushing up inflation. High inflation will force the Federal Reserve to maintain current interest rates, making it difficult to initiate a rate-cutting cycle.
This week is packed with economic data releases, including the Federal Reserve meeting minutes, Personal Consumption Expenditures (PCE) data, and the Consumer Price Index (CPI). Current market expectations suggest that a Fed rate cut is unlikely in the short term, a expectation that continues to weigh on gold prices and limit their upside potential.
- Risk Warning and Disclaimer
- The market involves risk, and trading may not be suitable for all investors. This article is for reference only and does not constitute personal investment advice, nor does it take into account certain users’ specific investment objectives, financial situation, or other needs. Any investment decisions made based on this information are at your own risk.