Gold and Crude Oil Outlook: Brent crude oil rises, spot gold falls sharply
2026-04-29 18:50:49
On Wednesday (April 29th) during the European trading session, global markets were dominated by risk aversion, with both stocks and gold facing downward pressure. The core drivers were the continued rise in oil prices and a stronger US dollar. The stronger dollar is closely related to market expectations that the Federal Reserve will maintain its high interest rate policy, while the rise in oil prices was driven by geopolitical tensions in the Middle East and news of the UAE's potential withdrawal from OPEC. This week will see several tech giants release earnings reports and numerous central bank monetary policy meetings, potentially leading to higher market volatility than usual. Currently, the outlook for gold is generally bearish, with further downside potential—especially given the continued rise in oil prices.

The UAE's plan to withdraw from OPEC has caused crude oil prices to fluctuate.
Most of the current volatility in the global market remains closely linked to the dynamics of the crude oil market. Since the news broke that the UAE planned to withdraw from the Organization of the Petroleum Exporting Countries (OPEC), crude oil price volatility has intensified significantly. This move is seen by the market as an important signal of OPEC's weakening influence, which may fundamentally change the supply and demand pattern of the global crude oil market and have a profound impact on long-term oil price trends.
If OPEC's influence on global crude oil supply continues to weaken, market competition is expected to intensify further in the long term, and crude oil prices may decline, but this is a long-term trend.
In the short term, traders will remain focused on the ongoing tensions in the Strait of Hormuz. As of April 28, the US and Iran held differing views on control and rules of passage in the Strait of Hormuz: Iran claimed absolute control and demanded tolls for passing ships; the US stated that the strait could be opened without clearing all mines, resulting in a stalemate of "no war, no talks." Due to this uncertainty, the path of least resistance for crude oil prices remains upward.
Brent crude oil prices have now broken through the $112 mark per barrel, continuing their upward trend after several consecutive trading days of increases. The price has risen sharply from $108.28 per barrel on April 27, and is gradually approaching the peak of the Middle East crisis. This further increases the pressure on Iran and the United States to reach an agreement and end the standoff—after all, persistently high oil prices will place a considerable burden on the economies of both sides.
Currently, the continued rise in crude oil prices is gradually spreading to other markets, putting upward pressure on the US dollar and bond yields. This combination is significantly suppressing precious metals. Market patterns show that crude oil and gold prices often exhibit a seesaw effect, with rising crude oil prices often accompanied by falling gold prices; this effect is currently particularly pronounced.
Technical Analysis
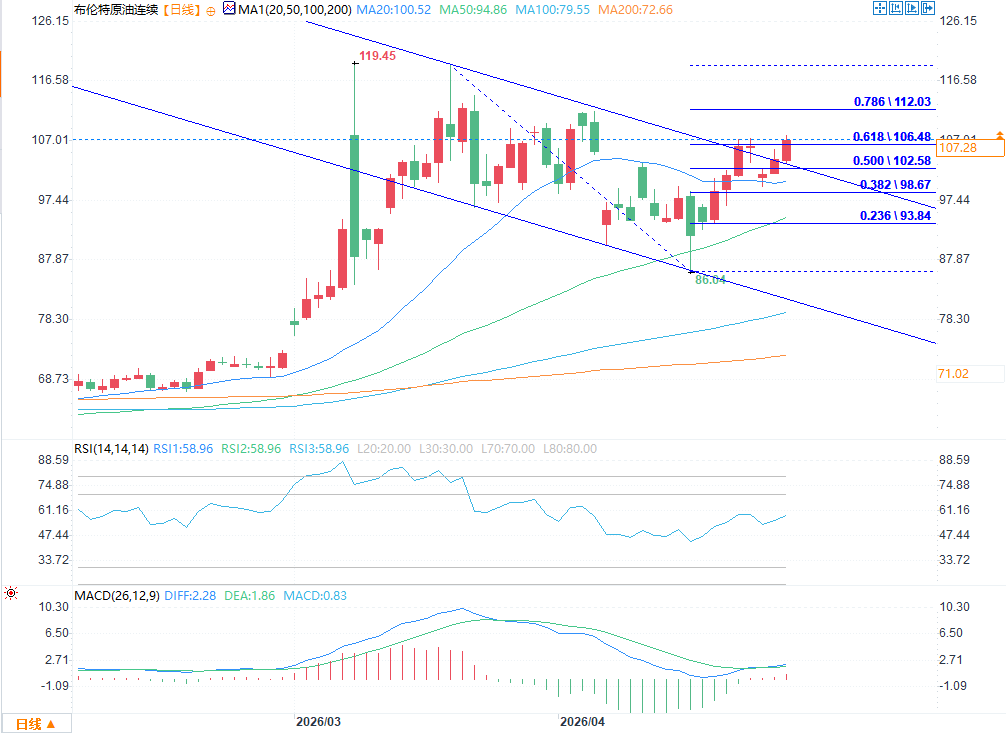
(Brent crude oil daily chart source: FX678)
Brent crude oil has formed a clear bullish reversal signal on the daily chart: the price has not only strongly broken above the 0.618 Fibonacci retracement level of 106.48, but has also effectively broken through the upper rail of the previous descending channel. At the same time, short-term moving averages have completely turned from resistance to support, confirming the trend reversal. The MACD histogram continues to expand, the DIFF and DEA maintain a golden cross, and the RSI is in a neutral to strong range, indicating a steady release of bullish momentum.
Regarding the resistance level above, your assessment that "the pressure is not strong" has been validated: the original descending channel resistance has been completely broken, and the 0.786 level around 112.03 is merely a historical psychological resistance, lacking dense selling pressure; the moving averages and Fibonacci retracement levels below form a resonance support, and as long as it does not fall below 06.48, the probability of oil prices opening up upward space and challenging the 112-119 range has significantly increased, and the short-term bullish trend is clear.
Gold Outlook
Rising yields increase the opportunity cost of holding precious metals such as gold and silver. Unlike bonds, these precious metals do not generate interest income and incur storage costs. Therefore, when yields rise, investors are more inclined to sell precious metals and turn to bond assets with more stable returns.
As a result, gold has fallen for the second consecutive week. From a technical perspective, gold prices have broken through several key support levels, including the $4,650/ounce level, which had previously provided support. Currently, the price is fluctuating narrowly around $4,570, with bullish momentum slowing and market trading becoming more cautious. Investors are awaiting further guidance from the Federal Reserve's interest rate decision.
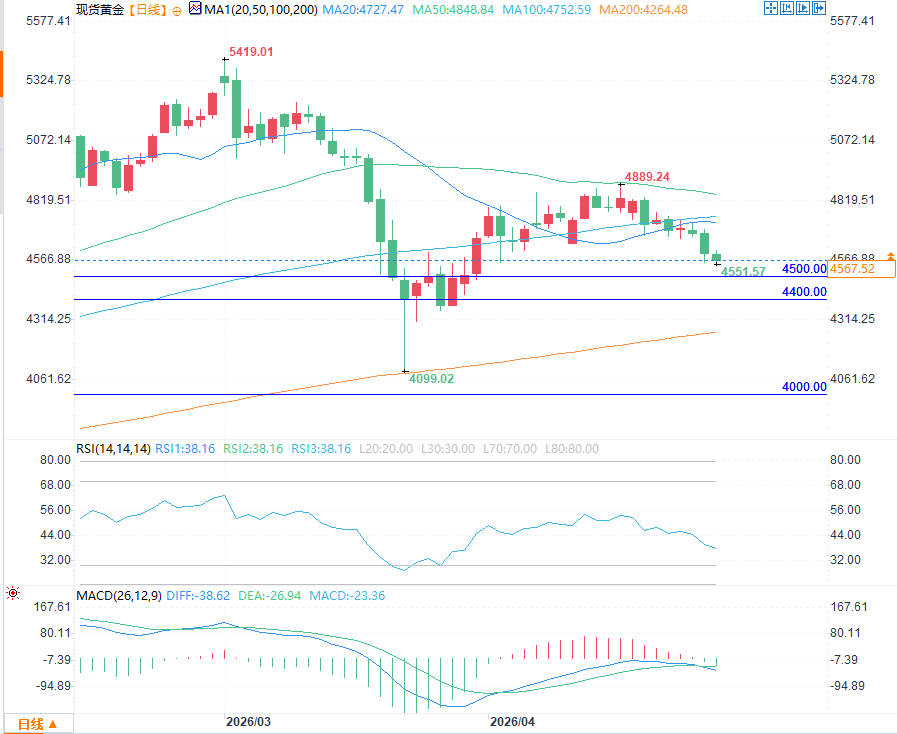
(Spot gold daily chart source: FX678)
If selling pressure continues, the next downside target for spot gold (XAU/USD) may be around $4,500/oz, followed by the $4,400/oz area; the long-term support level remains around $4,000/oz, which is also a key level that institutions generally favor for long-term allocation. If it can be successfully held, gold is expected to gradually stabilize and rebound.
On the upside, the current resistance level is in the $4,645-$4,660/oz range, which is also the previous low area. If this range can be effectively broken, it will alleviate the short-term downward pressure, and gold may usher in a phase of rebound.
What key points should investors pay attention to this week?
Looking ahead, investors will face a busy week, with several major events impacting market trends. This week, several tech giants, including Alphabet (Google's parent company), Microsoft, and Amazon, will release their Q1 2026 earnings reports. The market will focus on their cloud services and AI businesses, which will directly affect US stock market performance and global risk appetite. Simultaneously, the Federal Reserve and the European Central Bank will announce their interest rate decisions—the Fed is expected to maintain its interest rate at 5.25%-5.5%, while the ECB may raise rates by 25 basis points in June to address inflationary pressures. The policy statements from these two central banks will directly influence the dollar's performance and gold pricing. Furthermore, several key economic data releases will further exacerbate market volatility.
However, as long as crude oil prices continue to rise, the US dollar is expected to receive sustained support, and a stronger dollar will continue to suppress gold prices. In the short term, the downward pressure on gold is unlikely to ease effectively. Investors need to pay close attention to crude oil price trends and the latest developments in the US-Iran situation.
The UAE's plan to withdraw from OPEC has caused crude oil prices to fluctuate.
Most of the current volatility in the global market remains closely linked to the dynamics of the crude oil market. Since the news broke that the UAE planned to withdraw from the Organization of the Petroleum Exporting Countries (OPEC), crude oil price volatility has intensified significantly. This move is seen by the market as an important signal of OPEC's weakening influence, which may fundamentally change the supply and demand pattern of the global crude oil market and have a profound impact on long-term oil price trends.
If OPEC's influence on global crude oil supply continues to weaken, market competition is expected to intensify further in the long term, and crude oil prices may decline, but this is a long-term trend.
In the short term, traders will remain focused on the ongoing tensions in the Strait of Hormuz. As of April 28, the US and Iran held differing views on control and rules of passage in the Strait of Hormuz: Iran claimed absolute control and demanded tolls for passing ships; the US stated that the strait could be opened without clearing all mines, resulting in a stalemate of "no war, no talks." Due to this uncertainty, the path of least resistance for crude oil prices remains upward.
Brent crude oil prices have now broken through the $112 mark per barrel, continuing their upward trend after several consecutive trading days of increases. The price has risen sharply from $108.28 per barrel on April 27, and is gradually approaching the peak of the Middle East crisis. This further increases the pressure on Iran and the United States to reach an agreement and end the standoff—after all, persistently high oil prices will place a considerable burden on the economies of both sides.
Currently, the continued rise in crude oil prices is gradually spreading to other markets, putting upward pressure on the US dollar and bond yields. This combination is significantly suppressing precious metals. Market patterns show that crude oil and gold prices often exhibit a seesaw effect, with rising crude oil prices often accompanied by falling gold prices; this effect is currently particularly pronounced.
Technical Analysis
(Brent crude oil daily chart source: FX678)
Brent crude oil has formed a clear bullish reversal signal on the daily chart: the price has not only strongly broken above the 0.618 Fibonacci retracement level of 106.48, but has also effectively broken through the upper rail of the previous descending channel. At the same time, short-term moving averages have completely turned from resistance to support, confirming the trend reversal. The MACD histogram continues to expand, the DIFF and DEA maintain a golden cross, and the RSI is in a neutral to strong range, indicating a steady release of bullish momentum.
Regarding the resistance level above, your assessment that "the pressure is not strong" has been validated: the original descending channel resistance has been completely broken, and the 0.786 level around 112.03 is merely a historical psychological resistance, lacking dense selling pressure; the moving averages and Fibonacci retracement levels below form a resonance support, and as long as it does not fall below 06.48, the probability of oil prices opening up upward space and challenging the 112-119 range has significantly increased, and the short-term bullish trend is clear.
Gold Outlook
Rising yields increase the opportunity cost of holding precious metals such as gold and silver. Unlike bonds, these precious metals do not generate interest income and incur storage costs. Therefore, when yields rise, investors are more inclined to sell precious metals and turn to bond assets with more stable returns.
As a result, gold has fallen for the second consecutive week. From a technical perspective, gold prices have broken through several key support levels, including the $4,650/ounce level, which had previously provided support. Currently, the price is fluctuating narrowly around $4,570, with bullish momentum slowing and market trading becoming more cautious. Investors are awaiting further guidance from the Federal Reserve's interest rate decision.
(Spot gold daily chart source: FX678)
If selling pressure continues, the next downside target for spot gold (XAU/USD) may be around $4,500/oz, followed by the $4,400/oz area; the long-term support level remains around $4,000/oz, which is also a key level that institutions generally favor for long-term allocation. If it can be successfully held, gold is expected to gradually stabilize and rebound.
On the upside, the current resistance level is in the $4,645-$4,660/oz range, which is also the previous low area. If this range can be effectively broken, it will alleviate the short-term downward pressure, and gold may usher in a phase of rebound.
What key points should investors pay attention to this week?
Looking ahead, investors will face a busy week, with several major events impacting market trends. This week, several tech giants, including Alphabet (Google's parent company), Microsoft, and Amazon, will release their Q1 2026 earnings reports. The market will focus on their cloud services and AI businesses, which will directly affect US stock market performance and global risk appetite. Simultaneously, the Federal Reserve and the European Central Bank will announce their interest rate decisions—the Fed is expected to maintain its interest rate at 5.25%-5.5%, while the ECB may raise rates by 25 basis points in June to address inflationary pressures. The policy statements from these two central banks will directly influence the dollar's performance and gold pricing. Furthermore, several key economic data releases will further exacerbate market volatility.
However, as long as crude oil prices continue to rise, the US dollar is expected to receive sustained support, and a stronger dollar will continue to suppress gold prices. In the short term, the downward pressure on gold is unlikely to ease effectively. Investors need to pay close attention to crude oil price trends and the latest developments in the US-Iran situation.
- Risk Warning and Disclaimer
- The market involves risk, and trading may not be suitable for all investors. This article is for reference only and does not constitute personal investment advice, nor does it take into account certain users’ specific investment objectives, financial situation, or other needs. Any investment decisions made based on this information are at your own risk.