Gold has fallen below 4600; is the downward path clear?
2026-05-04 16:58:22
On Monday, May 4th, spot gold encountered selling pressure in early European trading, with prices falling further below $4,600 per ounce, gradually approaching Friday's swing lows. The US-Iran standoff in the Strait of Hormuz continued to escalate, with the Trump administration launching the "Freedom Project" to guide stranded vessels in the Gulf and warning of strong countermeasures against any interference. Iranian lawmaker Azizi directly accused the US of violating the ceasefire agreement, and the Islamic Revolutionary Guard Corps further accused the US of failing to fulfill its commitments, escalating the risk of renewed hostility.
While such geopolitical dynamics pushed up oil prices, reversing a slight opening gap, they also strengthened the dollar's attractiveness through inflation expectations, thereby suppressing demand for gold, a zero-yield asset. Meanwhile, the accelerating US inflation data for March clearly reinforced the Federal Reserve's stance of maintaining high interest rates. Last week's policy statement saw a record number of dissenting voices since 1992, with three members opposing the dovish tone. Minneapolis Fed President Kashkari explicitly stated on Sunday that a prolonged conflict with Iran would increase inflation risks and harm the economy, potentially necessitating consideration of raising interest rates. Such signals directly benefit the dollar, putting additional pressure on gold. With no major US data releases on Monday, market focus shifts to Friday's non-farm payroll report.
The ongoing standoff between the US and Iran in the Strait of Hormuz has evolved from a simple diplomatic friction into a core variable affecting global energy supply chains and inflation expectations. Trump's "Freedom Project," designed to reduce shipping risks, has been interpreted by Iran as a substantial breach of the ceasefire agreement, with the Islamic Revolutionary Guard Corps publicly warning of a possible resumption of hostilities. The lack of substantial progress in peace negotiations has supported the oil market, causing Brent crude prices to reverse their earlier losses. However, for gold, this geopolitical premium has not directly translated into safe-haven buying. Instead, the market is more focused on the transmission effect of the conflict on global energy costs—rising oil prices will further exacerbate already accelerating US inflation, prompting investors to reassess the policy paths of major central banks. Kashkari's statements on Sunday clearly indicated that a prolonged conflict would not only amplify inflationary pressures but could also cause substantial damage to economic growth, hinting at the possibility of interest rate hikes. This expectation directly pushed up the US dollar index, consequently increasing the cost of holding gold as a non-interest-bearing asset.
US inflation data for March accelerated more than expected, directly reinforcing the necessity for the Federal Reserve to maintain higher interest rates for a longer period. Last week's Federal Open Market Committee (FOMC) policy statement saw three members dissent against the dovish tone, the highest number of dissenters since 1992, indicating a significant widening of internal disagreements on the policy path. Kashkari, a voting member for 2026, publicly emphasized on Sunday the potential upside risks to inflation and economic damage from the Iranian conflict, without ruling out an interest rate hike. These signals contrast sharply with the market's previous optimistic expectations for rate cuts. The US dollar thus received support, and the implied real interest rate level of the 10-year US Treasury yield remained high, further reducing the attractiveness of gold as an investment. On Monday, there are no major US economic data releases to disrupt the dollar's movement; its performance will depend more on geopolitical headlines and statements from Fed officials. This Friday's non-farm payroll report will be a key watershed moment. Strong data will further confirm the Fed's hawkish stance, potentially pushing the dollar higher; weak data may trigger a short-term dollar pullback, but the overall policy tone remains tight, limiting the upside potential for gold. Driven by both inflation and policy, the structural pressures on gold are unlikely to dissipate in the short term.
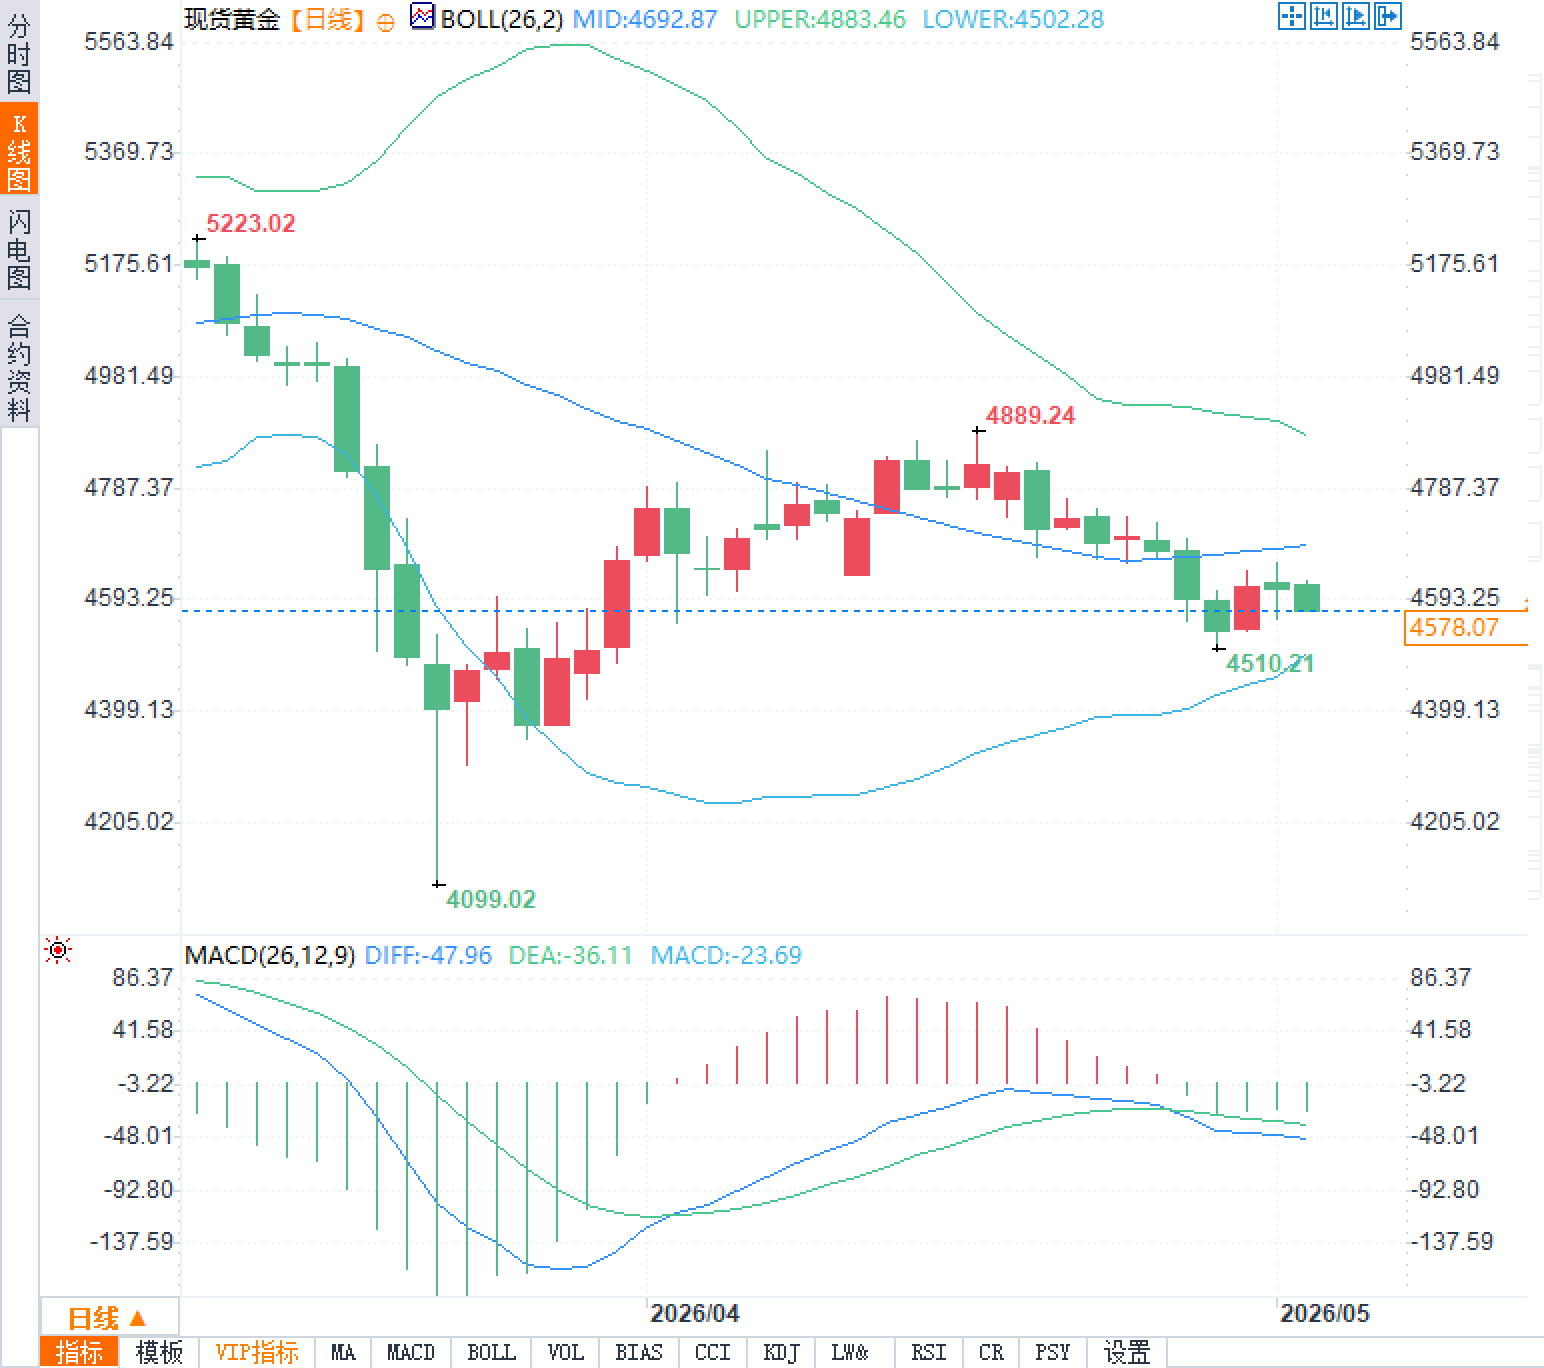
From the daily chart, spot gold prices are currently trading below the middle Bollinger Band, which is located at $4692.87/oz, with the upper band at $4883.46/oz and the lower band at $4502.28/oz. Recently, prices have retreated from a high of $4889.24/oz, testing a low near $4510.21/oz, and are currently trading around $4580/oz, indicating downward pressure. The MACD indicator (26,12,9) shows the DIFF line at -47.96, the DEA line at -36.11, and the MACD histogram at -23.69, with the histogram showing an expanding negative trend, indicating bearish momentum. The Bollinger Bands are narrowing, and the price is close to the lower band. Combined with the wide-range fluctuations between the previous low of $4099.02/oz and the high of $5223.02/oz, the short-term technical picture shows a bearish alignment of the moving average system. Key support levels are concentrated in the $4500-$4510/oz area. A decisive break below this level could open up further downside potential to the lower Bollinger Band. Resistance lies in the $4690-$4700/oz middle Bollinger Band area, a breakout that will be difficult. The technical pattern and bearish fundamentals are converging, making a downward move more likely than an upward move in the short term.
Friday's non-farm payroll report will be the biggest variable this week, with market expectations determining the short-term direction of the dollar's movement against gold. Strong data will further solidify the Federal Reserve's high-interest-rate stance, potentially accelerating the dollar index's rise and posing a risk of a rapid decline in gold prices. Conversely, if the data is significantly weaker than expected, the dollar may experience profit-taking, providing a technical rebound window for gold. However, the dual pressures of geopolitical factors and inflation expectations will continue to dominate the medium-term direction.
Current fundamentals indicate that the supply-demand balance for gold has shifted towards the downside: the inflationary risks driven by rising oil prices have been explicitly incorporated into policy considerations by Federal Reserve officials, thus strengthening the safe-haven appeal of the US dollar. Investors are continuously monitoring Iran's actual reaction to the "Freedom Project" and changes in statements made by other Federal Reserve officials this week. Overall, spot gold is likely to trade below $4,600/ounce, and any rebound may face selling pressure until geopolitical tensions or policy expectations substantially ease.
While such geopolitical dynamics pushed up oil prices, reversing a slight opening gap, they also strengthened the dollar's attractiveness through inflation expectations, thereby suppressing demand for gold, a zero-yield asset. Meanwhile, the accelerating US inflation data for March clearly reinforced the Federal Reserve's stance of maintaining high interest rates. Last week's policy statement saw a record number of dissenting voices since 1992, with three members opposing the dovish tone. Minneapolis Fed President Kashkari explicitly stated on Sunday that a prolonged conflict with Iran would increase inflation risks and harm the economy, potentially necessitating consideration of raising interest rates. Such signals directly benefit the dollar, putting additional pressure on gold. With no major US data releases on Monday, market focus shifts to Friday's non-farm payroll report.
How geopolitical stalemates affect gold prices
The ongoing standoff between the US and Iran in the Strait of Hormuz has evolved from a simple diplomatic friction into a core variable affecting global energy supply chains and inflation expectations. Trump's "Freedom Project," designed to reduce shipping risks, has been interpreted by Iran as a substantial breach of the ceasefire agreement, with the Islamic Revolutionary Guard Corps publicly warning of a possible resumption of hostilities. The lack of substantial progress in peace negotiations has supported the oil market, causing Brent crude prices to reverse their earlier losses. However, for gold, this geopolitical premium has not directly translated into safe-haven buying. Instead, the market is more focused on the transmission effect of the conflict on global energy costs—rising oil prices will further exacerbate already accelerating US inflation, prompting investors to reassess the policy paths of major central banks. Kashkari's statements on Sunday clearly indicated that a prolonged conflict would not only amplify inflationary pressures but could also cause substantial damage to economic growth, hinting at the possibility of interest rate hikes. This expectation directly pushed up the US dollar index, consequently increasing the cost of holding gold as a non-interest-bearing asset.
The dual impact of Fed hawkish divergence and inflation data
US inflation data for March accelerated more than expected, directly reinforcing the necessity for the Federal Reserve to maintain higher interest rates for a longer period. Last week's Federal Open Market Committee (FOMC) policy statement saw three members dissent against the dovish tone, the highest number of dissenters since 1992, indicating a significant widening of internal disagreements on the policy path. Kashkari, a voting member for 2026, publicly emphasized on Sunday the potential upside risks to inflation and economic damage from the Iranian conflict, without ruling out an interest rate hike. These signals contrast sharply with the market's previous optimistic expectations for rate cuts. The US dollar thus received support, and the implied real interest rate level of the 10-year US Treasury yield remained high, further reducing the attractiveness of gold as an investment. On Monday, there are no major US economic data releases to disrupt the dollar's movement; its performance will depend more on geopolitical headlines and statements from Fed officials. This Friday's non-farm payroll report will be a key watershed moment. Strong data will further confirm the Fed's hawkish stance, potentially pushing the dollar higher; weak data may trigger a short-term dollar pullback, but the overall policy tone remains tight, limiting the upside potential for gold. Driven by both inflation and policy, the structural pressures on gold are unlikely to dissipate in the short term.
Technical indicators reveal the short-term movement characteristics of spot gold.
From the daily chart, spot gold prices are currently trading below the middle Bollinger Band, which is located at $4692.87/oz, with the upper band at $4883.46/oz and the lower band at $4502.28/oz. Recently, prices have retreated from a high of $4889.24/oz, testing a low near $4510.21/oz, and are currently trading around $4580/oz, indicating downward pressure. The MACD indicator (26,12,9) shows the DIFF line at -47.96, the DEA line at -36.11, and the MACD histogram at -23.69, with the histogram showing an expanding negative trend, indicating bearish momentum. The Bollinger Bands are narrowing, and the price is close to the lower band. Combined with the wide-range fluctuations between the previous low of $4099.02/oz and the high of $5223.02/oz, the short-term technical picture shows a bearish alignment of the moving average system. Key support levels are concentrated in the $4500-$4510/oz area. A decisive break below this level could open up further downside potential to the lower Bollinger Band. Resistance lies in the $4690-$4700/oz middle Bollinger Band area, a breakout that will be difficult. The technical pattern and bearish fundamentals are converging, making a downward move more likely than an upward move in the short term.
| Key technology position | Price level (USD/ounce) | meaning |
|---|---|---|
| Bollinger Bands Upper Rail | 4883.46 | Previous high resistance |
| Bollinger Bands Middle Rail | 4692.87 | Short-term resistance |
| Current trading range | 4580 | Downward channel |
| Bollinger Band lower rail | 4502.28 | Important support |
| Recent swing lows | 4510.21 | Friday's low reference |
This Week's Non-Farm Payrolls Data Preview and Market Risk Assessment
Friday's non-farm payroll report will be the biggest variable this week, with market expectations determining the short-term direction of the dollar's movement against gold. Strong data will further solidify the Federal Reserve's high-interest-rate stance, potentially accelerating the dollar index's rise and posing a risk of a rapid decline in gold prices. Conversely, if the data is significantly weaker than expected, the dollar may experience profit-taking, providing a technical rebound window for gold. However, the dual pressures of geopolitical factors and inflation expectations will continue to dominate the medium-term direction.
Current fundamentals indicate that the supply-demand balance for gold has shifted towards the downside: the inflationary risks driven by rising oil prices have been explicitly incorporated into policy considerations by Federal Reserve officials, thus strengthening the safe-haven appeal of the US dollar. Investors are continuously monitoring Iran's actual reaction to the "Freedom Project" and changes in statements made by other Federal Reserve officials this week. Overall, spot gold is likely to trade below $4,600/ounce, and any rebound may face selling pressure until geopolitical tensions or policy expectations substantially ease.
- Risk Warning and Disclaimer
- The market involves risk, and trading may not be suitable for all investors. This article is for reference only and does not constitute personal investment advice, nor does it take into account certain users’ specific investment objectives, financial situation, or other needs. Any investment decisions made based on this information are at your own risk.