Better-than-expected US CPI data supported a rebound in the US dollar index, awaiting the release of PPI data.
2026-05-13 14:18:44
The US dollar index (DXY) remained range-bound in Asian trading on Wednesday, currently trading around 98.30. The dollar had previously risen for two consecutive trading days, primarily driven by stronger-than-expected US inflation data and continued tensions in the Middle East. Market risk aversion has clearly intensified recently. US President Trump stated that there are only two outcomes regarding Iran: a new agreement or a "complete defeat." Although Trump claimed Iran was "under control," the market remains concerned about a potential further escalation of the situation in the Middle East.
Meanwhile, Iranian Deputy Foreign Minister Qazem Gharibabadi stated that any feasible peace agreement must include reparations, recognition of sovereignty over the Strait of Hormuz, and the complete lifting of US sanctions. Given the Strait of Hormuz's crucial role in global energy transport, market concerns exist that a prolonged conflict could further restrict global oil supplies, thereby driving up international energy prices. Amidst heightened risk aversion, the US dollar, as one of the world's major safe-haven currencies, has regained support from capital inflows.
However, the core factor currently driving the dollar's strength remains the better-than-expected US inflation data. Data released by the US Bureau of Labor Statistics on Tuesday showed that the US Consumer Price Index (CPI) rose 0.6% month-on-month in April, higher than the previous level, while the annual rate rose to 3.8% , the highest level since May 2023. At the same time, the core CPI, excluding food and energy prices, also rose to 2.8% year-on-year, indicating that core inflation in the US remains resilient.
Following the release of inflation data, the market quickly adjusted its expectations for Federal Reserve policy. Previously, the market had anticipated a possible rate cut by the Fed this year, but with inflation picking up again, investors have now largely ruled out a rate cut in 2026. Some interest rate markets are even betting that the Fed may raise rates by another 25 basis points before the end of the year to further suppress inflation risks.
Some Wall Street firms believe that rising energy prices in the United States are pushing up inflationary pressures again, and the Federal Reserve may need to maintain high interest rates for a longer period of time.
U.S. Treasury yields have therefore remained high, providing support for the dollar index. Continued capital inflows into dollar assets have kept the dollar relatively strong among major currencies. The market is currently awaiting the release of the U.S. April Producer Price Index (PPI) data on Wednesday evening, hoping to further assess future price pressures based on production-side inflation performance.
As the ongoing tensions in the Middle East continue to drive up energy costs, the market is concerned that rising oil prices may gradually be passed on to businesses and further impact future inflation in the United States. If PPI data continues to exceed expectations, it could further strengthen market expectations that the Federal Reserve will maintain high interest rates or even raise them, thereby continuing to push up the US dollar.
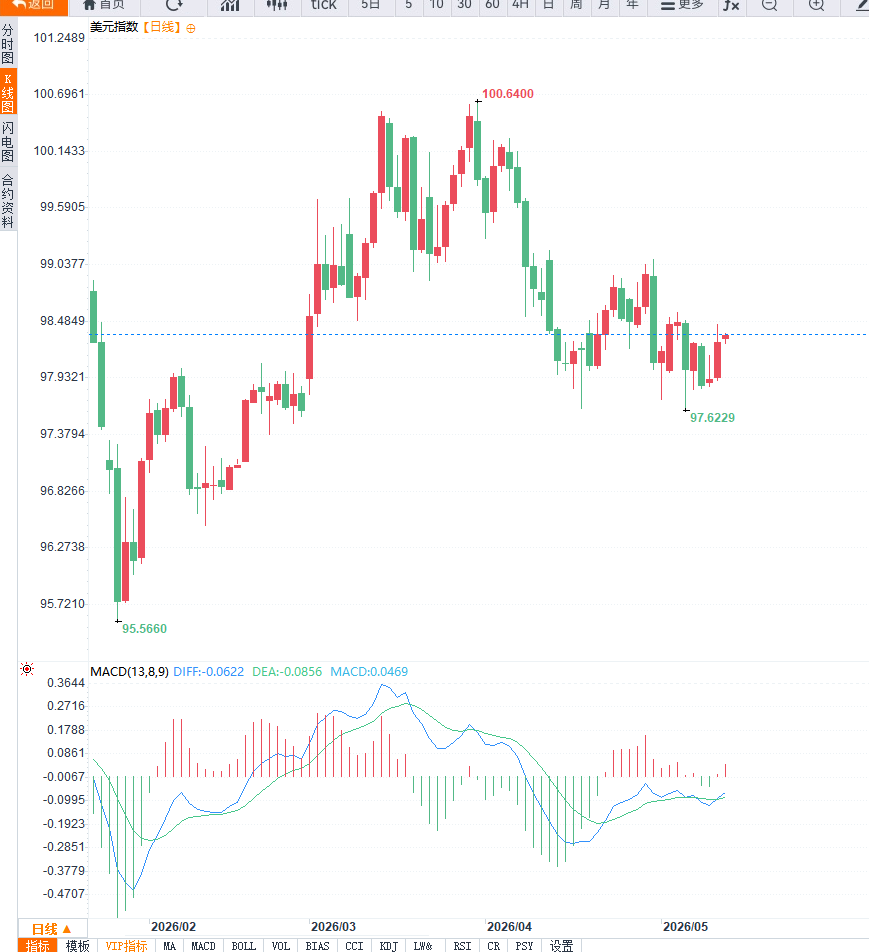
From a daily chart perspective, the US dollar index is currently maintaining a generally bullish medium- to long-term structure. After a previous pullback, the index has regained its footing above the 50-day EMA and continues to rebound towards the 100 level. Technically, the daily MACD has returned above the zero line, and the red histogram is expanding, indicating that the bullish momentum of the dollar is strengthening again. The Stochastic Relative Strength Index (SRSI) has also rebounded significantly from its lows and is currently approaching the 60 area, suggesting that market buying sentiment is improving. The first key resistance level on the daily chart is at the 99.00 level ; a break above this level could lead to a further test of the 100.20 area. Further important medium-term resistance lies around 101.50. On the downside, the 97.60 area forms the initial support, followed by the 50-day EMA support area around 96.80. If market sentiment weakens, the dollar index may retest these support levels.
Overall, the core logic behind the current trend of the US dollar index still revolves around "high US inflation" and "global geopolitical risks." As long as the Federal Reserve maintains its high interest rate expectations and the situation in the Middle East remains tense, the US dollar is likely to maintain a relatively strong trend.
Editor's Summary : The core drivers of the current rise in the US dollar index have returned to high US inflation and global safe-haven demand. Better-than-expected US CPI data suggests the Federal Reserve is unlikely to shift to an easing policy in the short term, while rising energy prices have further intensified market concerns about future inflation. Meanwhile, continued tensions in the Middle East have increased safe-haven demand in global financial markets, further driving capital inflows into the US dollar. From a technical perspective, the US dollar index has regained its medium-term upward momentum, but as the index gradually approaches the key 99-100 range, market volatility may intensify further. The future direction of the US dollar will depend on US PPI data, the trend of US Treasury yields, and changes in the Middle East situation.
Meanwhile, Iranian Deputy Foreign Minister Qazem Gharibabadi stated that any feasible peace agreement must include reparations, recognition of sovereignty over the Strait of Hormuz, and the complete lifting of US sanctions. Given the Strait of Hormuz's crucial role in global energy transport, market concerns exist that a prolonged conflict could further restrict global oil supplies, thereby driving up international energy prices. Amidst heightened risk aversion, the US dollar, as one of the world's major safe-haven currencies, has regained support from capital inflows.
However, the core factor currently driving the dollar's strength remains the better-than-expected US inflation data. Data released by the US Bureau of Labor Statistics on Tuesday showed that the US Consumer Price Index (CPI) rose 0.6% month-on-month in April, higher than the previous level, while the annual rate rose to 3.8% , the highest level since May 2023. At the same time, the core CPI, excluding food and energy prices, also rose to 2.8% year-on-year, indicating that core inflation in the US remains resilient.
Following the release of inflation data, the market quickly adjusted its expectations for Federal Reserve policy. Previously, the market had anticipated a possible rate cut by the Fed this year, but with inflation picking up again, investors have now largely ruled out a rate cut in 2026. Some interest rate markets are even betting that the Fed may raise rates by another 25 basis points before the end of the year to further suppress inflation risks.
Some Wall Street firms believe that rising energy prices in the United States are pushing up inflationary pressures again, and the Federal Reserve may need to maintain high interest rates for a longer period of time.
U.S. Treasury yields have therefore remained high, providing support for the dollar index. Continued capital inflows into dollar assets have kept the dollar relatively strong among major currencies. The market is currently awaiting the release of the U.S. April Producer Price Index (PPI) data on Wednesday evening, hoping to further assess future price pressures based on production-side inflation performance.
As the ongoing tensions in the Middle East continue to drive up energy costs, the market is concerned that rising oil prices may gradually be passed on to businesses and further impact future inflation in the United States. If PPI data continues to exceed expectations, it could further strengthen market expectations that the Federal Reserve will maintain high interest rates or even raise them, thereby continuing to push up the US dollar.
From a daily chart perspective, the US dollar index is currently maintaining a generally bullish medium- to long-term structure. After a previous pullback, the index has regained its footing above the 50-day EMA and continues to rebound towards the 100 level. Technically, the daily MACD has returned above the zero line, and the red histogram is expanding, indicating that the bullish momentum of the dollar is strengthening again. The Stochastic Relative Strength Index (SRSI) has also rebounded significantly from its lows and is currently approaching the 60 area, suggesting that market buying sentiment is improving. The first key resistance level on the daily chart is at the 99.00 level ; a break above this level could lead to a further test of the 100.20 area. Further important medium-term resistance lies around 101.50. On the downside, the 97.60 area forms the initial support, followed by the 50-day EMA support area around 96.80. If market sentiment weakens, the dollar index may retest these support levels.
Overall, the core logic behind the current trend of the US dollar index still revolves around "high US inflation" and "global geopolitical risks." As long as the Federal Reserve maintains its high interest rate expectations and the situation in the Middle East remains tense, the US dollar is likely to maintain a relatively strong trend.
Editor's Summary : The core drivers of the current rise in the US dollar index have returned to high US inflation and global safe-haven demand. Better-than-expected US CPI data suggests the Federal Reserve is unlikely to shift to an easing policy in the short term, while rising energy prices have further intensified market concerns about future inflation. Meanwhile, continued tensions in the Middle East have increased safe-haven demand in global financial markets, further driving capital inflows into the US dollar. From a technical perspective, the US dollar index has regained its medium-term upward momentum, but as the index gradually approaches the key 99-100 range, market volatility may intensify further. The future direction of the US dollar will depend on US PPI data, the trend of US Treasury yields, and changes in the Middle East situation.
- Risk Warning and Disclaimer
- The market involves risk, and trading may not be suitable for all investors. This article is for reference only and does not constitute personal investment advice, nor does it take into account certain users’ specific investment objectives, financial situation, or other needs. Any investment decisions made based on this information are at your own risk.