A ceasefire is expected to boost gold prices, but PCE data is putting downward pressure on them – gold is caught in a dilemma.
2026-05-29 16:38:59
Gold traded around $4,520 in Asian trading on Friday (May 29), up 0.5% from the previous day's close. Progress on the US-Iran ceasefire agreement had weakened safe-haven demand for the US dollar, providing support for gold prices.
However, the US April PCE inflation data hit a three-year high (3.8% overall and 3.3% core), reinforcing expectations of a Fed rate hike this year. Market pricing indicates a roughly 50% probability of a 25 basis point rate hike by the end of 2026, which limits the upside potential for gold prices.
According to media reports on the 28th, citing US officials, US and Iranian negotiators have reached an agreement on a memorandum of understanding, but it still requires final approval from President Trump. US officials stated that the terms of the memorandum were largely agreed upon on the 26th, but both sides still need approval from senior leaders. Iran stated that it has obtained the necessary approvals and is ready to sign. US negotiators briefed Trump on the details of the memorandum. "The president told the mediators that he wanted a few days to consider the matter."
This news eased market concerns about a prolonged disruption to regional oil flows, putting pressure on crude oil prices near monthly lows and thus dampening expectations of interest rate hikes.
Furthermore, the latest peace optimism has weakened the dollar's reserve currency status, providing support for gold prices. However, the peace proposal still requires final approval from US President Trump. In addition, significant differences remain between the US and Iran over Iran's nuclear program and the Strait of Hormuz, leaving investors skeptical about the prospects of ending the three-month-long conflict.
The possibility of renewed open hostilities between the US and Iran should dampen market optimism. A ceasefire agreement still requires Trump's approval, and the two sides have fundamental differences on issues such as nuclear programs and control of the Strait of Hormuz; any miscalculation could lead to a renewed conflict.
This uncertainty should help limit further declines in the dollar, while also limiting upside potential for gold prices. For gold, safe-haven demand and expectations of interest rate hikes are offsetting each other, leaving gold prices in a dilemma.
Therefore, although the ceasefire news is positive for gold prices, the continued existence of geopolitical risks makes it difficult for gold prices to form a one-sided upward trend. Until the situation between the US and Iran becomes clearer, gold prices are more likely to remain range-bound rather than trend upwards.
Dollar bears also appear hesitant due to US inflation data. The US April PCE price index accelerated to 3.8% year-on-year, higher than the previous 3.5%, mainly driven by increased energy costs due to the Middle East conflict. Core PCE, excluding food and energy, rose 3.3% year-on-year, in line with expectations.
These data reinforce expectations that the Federal Reserve may need to maintain high interest rates for an extended period. The revised annualized quarterly GDP growth rate for the first quarter in the US was 1.6%, lower than the initial estimate of 2.0%. Nevertheless, against the backdrop of persistent inflation, traders seem convinced that the Fed will raise interest rates before the end of the year.
According to the CME FedWatch tool, traders are currently pricing in a roughly 50% probability of the Federal Reserve raising interest rates by 25 basis points by the end of 2026. This expectation is a key factor putting pressure on non-yielding gold.
Therefore, a degree of caution is warranted before betting on a significant weakening of the US dollar or a further rise in gold prices.
Considering the daily chart trend, moving averages, support and resistance levels, and technical indicators, the target stock is generally weak in the medium term. After a previous surge, it has fallen back and is currently in a low-level consolidation and bottoming phase after the decline.
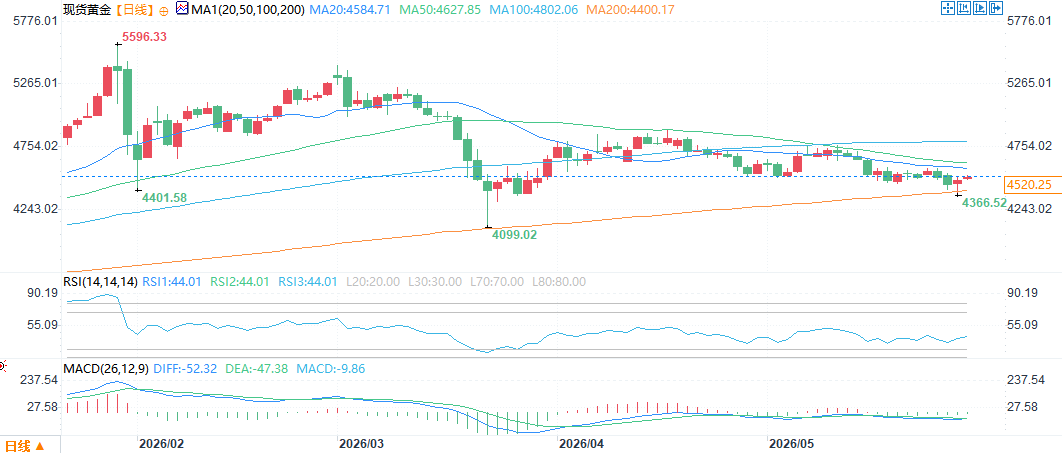
(Spot gold daily chart, source: FX678)
The price is currently trading below multiple medium-term moving averages, including the 20-day, 50-day, and 100-day moving averages. These moving averages are in a typical bearish alignment, suppressing the price's upward movement. Short-term rebounds face significant resistance, with the primary resistance level concentrated around 4510. Further resistance lies at 4584 (corresponding to the 20-day moving average) and 4627 (corresponding to the 50-day moving average).
However, the price has stabilized above the 200-day moving average (MA200), forming double support with the previous low of 4366. Further support lies at the previous low of 4099, indicating that the long-term trend has not deteriorated and the downside potential is relatively limited. In terms of indicators, the RSI is in the neutral range, neither overbought nor oversold, suggesting a balanced struggle between bulls and bears, with short-term directional signals unclear. The MACD indicator remains in the green bars, with the DIFF below the DEA, indicating the bearish pattern has not yet reversed, but the green bars are gradually narrowing, reflecting a weakening downward momentum and the possibility of a technical correction. Overall, the market lacks a clear short-term trend and is mainly consolidating within a range. Downside risks have eased somewhat, but a full reversal signal has not yet appeared.
In terms of trading strategy, it is crucial to pay close attention to the breakout of key support and resistance levels. If the long-term moving average support around 4400 is effectively held, a rebound opportunity can be awaited, with attention focused on the strength of the breakout from the 4510 to 4584 resistance zone. Once the core support level is breached, the market will weaken again and move towards the low of 4099. At this stage, caution is advised, and the subsequent trend should be judged based on key price levels.
At 16:06 Beijing time on May 29, spot gold was trading at $4,518.69 per ounce.
However, the US April PCE inflation data hit a three-year high (3.8% overall and 3.3% core), reinforcing expectations of a Fed rate hike this year. Market pricing indicates a roughly 50% probability of a 25 basis point rate hike by the end of 2026, which limits the upside potential for gold prices.
Ceasefire agreement progress: Supporting gold prices but still subject to uncertainty
According to media reports on the 28th, citing US officials, US and Iranian negotiators have reached an agreement on a memorandum of understanding, but it still requires final approval from President Trump. US officials stated that the terms of the memorandum were largely agreed upon on the 26th, but both sides still need approval from senior leaders. Iran stated that it has obtained the necessary approvals and is ready to sign. US negotiators briefed Trump on the details of the memorandum. "The president told the mediators that he wanted a few days to consider the matter."
This news eased market concerns about a prolonged disruption to regional oil flows, putting pressure on crude oil prices near monthly lows and thus dampening expectations of interest rate hikes.
Furthermore, the latest peace optimism has weakened the dollar's reserve currency status, providing support for gold prices. However, the peace proposal still requires final approval from US President Trump. In addition, significant differences remain between the US and Iran over Iran's nuclear program and the Strait of Hormuz, leaving investors skeptical about the prospects of ending the three-month-long conflict.
The potential resurgence of the US-Iran conflict could limit the upside potential for gold prices.
The possibility of renewed open hostilities between the US and Iran should dampen market optimism. A ceasefire agreement still requires Trump's approval, and the two sides have fundamental differences on issues such as nuclear programs and control of the Strait of Hormuz; any miscalculation could lead to a renewed conflict.
This uncertainty should help limit further declines in the dollar, while also limiting upside potential for gold prices. For gold, safe-haven demand and expectations of interest rate hikes are offsetting each other, leaving gold prices in a dilemma.
Therefore, although the ceasefire news is positive for gold prices, the continued existence of geopolitical risks makes it difficult for gold prices to form a one-sided upward trend. Until the situation between the US and Iran becomes clearer, gold prices are more likely to remain range-bound rather than trend upwards.
US PCE inflation hits three-year high, reinforcing expectations of interest rate hikes.
Dollar bears also appear hesitant due to US inflation data. The US April PCE price index accelerated to 3.8% year-on-year, higher than the previous 3.5%, mainly driven by increased energy costs due to the Middle East conflict. Core PCE, excluding food and energy, rose 3.3% year-on-year, in line with expectations.
These data reinforce expectations that the Federal Reserve may need to maintain high interest rates for an extended period. The revised annualized quarterly GDP growth rate for the first quarter in the US was 1.6%, lower than the initial estimate of 2.0%. Nevertheless, against the backdrop of persistent inflation, traders seem convinced that the Fed will raise interest rates before the end of the year.
Market pricing: The probability of an interest rate hike before the end of the year is about 50%.
According to the CME FedWatch tool, traders are currently pricing in a roughly 50% probability of the Federal Reserve raising interest rates by 25 basis points by the end of 2026. This expectation is a key factor putting pressure on non-yielding gold.
Therefore, a degree of caution is warranted before betting on a significant weakening of the US dollar or a further rise in gold prices.
Considering the daily chart trend, moving averages, support and resistance levels, and technical indicators, the target stock is generally weak in the medium term. After a previous surge, it has fallen back and is currently in a low-level consolidation and bottoming phase after the decline.
(Spot gold daily chart, source: FX678)
The price is currently trading below multiple medium-term moving averages, including the 20-day, 50-day, and 100-day moving averages. These moving averages are in a typical bearish alignment, suppressing the price's upward movement. Short-term rebounds face significant resistance, with the primary resistance level concentrated around 4510. Further resistance lies at 4584 (corresponding to the 20-day moving average) and 4627 (corresponding to the 50-day moving average).
However, the price has stabilized above the 200-day moving average (MA200), forming double support with the previous low of 4366. Further support lies at the previous low of 4099, indicating that the long-term trend has not deteriorated and the downside potential is relatively limited. In terms of indicators, the RSI is in the neutral range, neither overbought nor oversold, suggesting a balanced struggle between bulls and bears, with short-term directional signals unclear. The MACD indicator remains in the green bars, with the DIFF below the DEA, indicating the bearish pattern has not yet reversed, but the green bars are gradually narrowing, reflecting a weakening downward momentum and the possibility of a technical correction. Overall, the market lacks a clear short-term trend and is mainly consolidating within a range. Downside risks have eased somewhat, but a full reversal signal has not yet appeared.
In terms of trading strategy, it is crucial to pay close attention to the breakout of key support and resistance levels. If the long-term moving average support around 4400 is effectively held, a rebound opportunity can be awaited, with attention focused on the strength of the breakout from the 4510 to 4584 resistance zone. Once the core support level is breached, the market will weaken again and move towards the low of 4099. At this stage, caution is advised, and the subsequent trend should be judged based on key price levels.
At 16:06 Beijing time on May 29, spot gold was trading at $4,518.69 per ounce.
- Risk Warning and Disclaimer
- The market involves risk, and trading may not be suitable for all investors. This article is for reference only and does not constitute personal investment advice, nor does it take into account certain users’ specific investment objectives, financial situation, or other needs. Any investment decisions made based on this information are at your own risk.