How long can the positive feedback loop of the US dollar last? Two major risks are undermining it.
2026-06-25 13:47:53
On Thursday (June 25) during Asian trading hours, the US dollar index fluctuated at high levels and is currently trading around 101.50, after touching a 13-month high of 101.80 overnight.
Market data shows that the US dollar index is on track for its biggest gain in nearly a year this month, highlighting its strong momentum.
The core macroeconomic backdrop to the strengthening of the US dollar is that energy price volatility triggered by the situation in the Middle East has reversed market expectations for easing by the Federal Reserve this year.
Previously, the market widely expected the Federal Reserve to enter a rate-cutting cycle, but geopolitical conflicts pushed up energy prices, exacerbating inflationary pressures and forcing the market to reassess the policy path.
In his first public appearance, newly appointed Federal Reserve Chairman Warsh signaled a hawkish stance, emphasizing a firm focus on curbing inflation and noting that the overall U.S. economy remained stable. This statement further solidified market bets on a Fed rate hike as early as October.
At the same time, continued better-than-expected US economic data—with a recent across-the-board strengthening of the PMI—has reinforced the narrative of "American exceptionalism," providing solid fundamental support for the US dollar.
Since the beginning of May, the yield on the two-year U.S. Treasury note has risen by about 27 basis points to a range of 4.15% to 4.18%.
The head of foreign exchange research at Standard Chartered Bank pointed out that the market is pricing in a U.S. outlook that is both cyclical and structurally superior to other major economies.
AI-driven productivity gains are expected to support corporate profits and attract continued capital inflows into U.S. assets.
This trend is creating a positive feedback loop for the US dollar: a strong dollar attracts more capital inflows, pushes up US Treasury yields, and further strengthens the exchange rate advantage.
Analysts warn that although the current "positive feedback loop" of the US dollar is strong, its momentum may quickly run out under two key scenarios, triggering the risk of a currency correction.
First, inflation data may fall short of expectations. If the upcoming US May core PCE inflation figure is significantly lower than market expectations, indicating a continued easing of inflationary pressures, investors' bets on a Fed rate hike in October will cool rapidly, and the dollar index may experience a quick correction, even erasing some of its recent gains.
Second, geopolitical risks have eased significantly. If the US-Iran peace agreement negotiations achieve a substantial breakthrough, the situation in the Middle East stabilizes, navigation in the Strait of Hormuz is fully restored, and oil prices fall further, global inflationary pressures will be alleviated, reducing the necessity for the Federal Reserve to maintain a hawkish stance, thereby weakening the dollar's interest rate advantage and safe-haven support.
Investors should be wary of the aforementioned catalysts and are advised to pay attention to this week's core PCE data and Middle East diplomatic developments, and prepare for risk hedging.
The market is currently highly focused on the US May core PCE inflation data to be released Thursday evening. This indicator is the Federal Reserve's most valued inflation measurement tool and can more accurately reflect the underlying inflation trend after excluding fluctuations in food and energy prices.
The market currently expects the core PCE to rise by about 0.2% month-on-month. If the actual data significantly exceeds expectations (e.g., a month-on-month increase of 0.3% or higher), it will further strengthen the expectation of a Fed rate hike, push the dollar index to break through the 102 mark, and continue its strong performance this month.
Conversely, if the data falls short of expectations or shows a significant slowdown in inflationary pressures, it could quickly weaken hawkish bets, triggering profit-taking by dollar bulls and causing a temporary pullback, especially given that the dollar is currently at a 13-month high. Investors should closely monitor the statements from Federal Reserve officials after the data release, as the PCE results will be a key catalyst determining the short-term trend of the dollar.
The US dollar index is currently maintaining a strong bullish trend, with the price reaching a recent high of 101.80. The moving average system is in a complete bullish alignment, with the price firmly holding above the 20-day, 50-day, 100-day, and 200-day moving averages. The short-term 20-day moving average (100.13) provides strong dynamic support, and all moving averages are diverging upwards in sync, indicating a solid upward trend structure.
The MACD indicator DIFF (0.6006) continues to run above DEA (0.4476), and the red momentum bars continue to expand, indicating sufficient bullish momentum. There are currently no signs of a top divergence or reversal.
The RSI indicator rose to 73.48, approaching the 80 overbought threshold. There is a short-term need for a technical pullback to correct the indicator, but this does not undermine the medium- to long-term upward trend.
The overall market is dominated by bulls, and the short-term RSI is approaching the overbought zone, indicating a slight pullback is likely. Buying on dips to the short-term moving average support level is a good opportunity. A breakout above 101.80 with increased volume would open up further upside potential. Only a decisive break below the 20-day moving average would reverse the bullish trend in the short term.
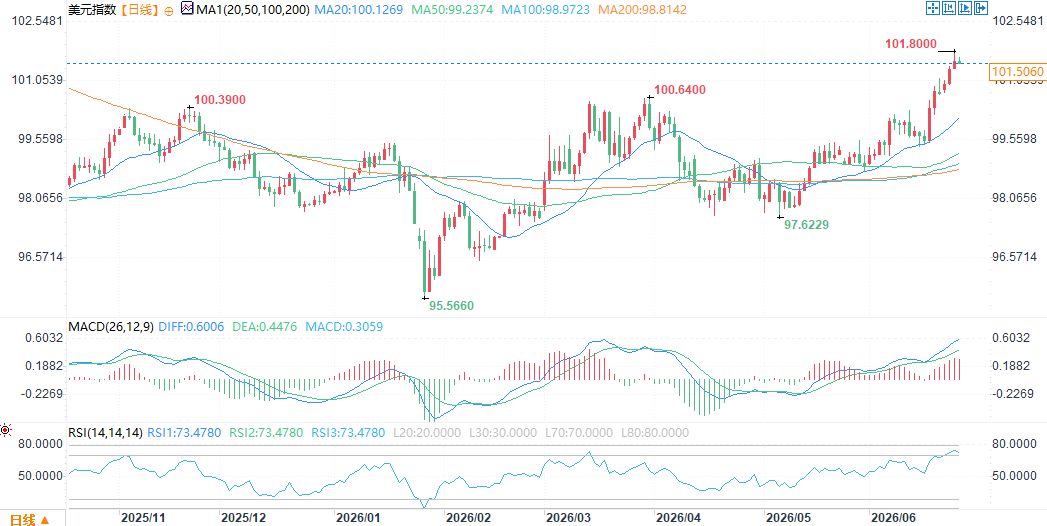
(US Dollar Index Daily Chart, Source: FX678)
At 13:47 Beijing time on June 25, the US dollar index was at 105.54.
Market data shows that the US dollar index is on track for its biggest gain in nearly a year this month, highlighting its strong momentum.
Macroeconomic drivers: Middle East situation reverses expectations of easing, Warsh's hawkish signals solidify bets on interest rate hikes.
The core macroeconomic backdrop to the strengthening of the US dollar is that energy price volatility triggered by the situation in the Middle East has reversed market expectations for easing by the Federal Reserve this year.
Previously, the market widely expected the Federal Reserve to enter a rate-cutting cycle, but geopolitical conflicts pushed up energy prices, exacerbating inflationary pressures and forcing the market to reassess the policy path.
In his first public appearance, newly appointed Federal Reserve Chairman Warsh signaled a hawkish stance, emphasizing a firm focus on curbing inflation and noting that the overall U.S. economy remained stable. This statement further solidified market bets on a Fed rate hike as early as October.
At the same time, continued better-than-expected US economic data—with a recent across-the-board strengthening of the PMI—has reinforced the narrative of "American exceptionalism," providing solid fundamental support for the US dollar.
A positive feedback loop for the US dollar is forming.
Since the beginning of May, the yield on the two-year U.S. Treasury note has risen by about 27 basis points to a range of 4.15% to 4.18%.
The head of foreign exchange research at Standard Chartered Bank pointed out that the market is pricing in a U.S. outlook that is both cyclical and structurally superior to other major economies.
AI-driven productivity gains are expected to support corporate profits and attract continued capital inflows into U.S. assets.
This trend is creating a positive feedback loop for the US dollar: a strong dollar attracts more capital inflows, pushes up US Treasury yields, and further strengthens the exchange rate advantage.
Risk warning: The positive feedback loop faces two major potential reversal factors.
Analysts warn that although the current "positive feedback loop" of the US dollar is strong, its momentum may quickly run out under two key scenarios, triggering the risk of a currency correction.
First, inflation data may fall short of expectations. If the upcoming US May core PCE inflation figure is significantly lower than market expectations, indicating a continued easing of inflationary pressures, investors' bets on a Fed rate hike in October will cool rapidly, and the dollar index may experience a quick correction, even erasing some of its recent gains.
Second, geopolitical risks have eased significantly. If the US-Iran peace agreement negotiations achieve a substantial breakthrough, the situation in the Middle East stabilizes, navigation in the Strait of Hormuz is fully restored, and oil prices fall further, global inflationary pressures will be alleviated, reducing the necessity for the Federal Reserve to maintain a hawkish stance, thereby weakening the dollar's interest rate advantage and safe-haven support.
Investors should be wary of the aforementioned catalysts and are advised to pay attention to this week's core PCE data and Middle East diplomatic developments, and prepare for risk hedging.
Short-term focus: Core PCE data will determine the next direction of the US dollar.
The market is currently highly focused on the US May core PCE inflation data to be released Thursday evening. This indicator is the Federal Reserve's most valued inflation measurement tool and can more accurately reflect the underlying inflation trend after excluding fluctuations in food and energy prices.
The market currently expects the core PCE to rise by about 0.2% month-on-month. If the actual data significantly exceeds expectations (e.g., a month-on-month increase of 0.3% or higher), it will further strengthen the expectation of a Fed rate hike, push the dollar index to break through the 102 mark, and continue its strong performance this month.
Conversely, if the data falls short of expectations or shows a significant slowdown in inflationary pressures, it could quickly weaken hawkish bets, triggering profit-taking by dollar bulls and causing a temporary pullback, especially given that the dollar is currently at a 13-month high. Investors should closely monitor the statements from Federal Reserve officials after the data release, as the PCE results will be a key catalyst determining the short-term trend of the dollar.
Technical Analysis
The US dollar index is currently maintaining a strong bullish trend, with the price reaching a recent high of 101.80. The moving average system is in a complete bullish alignment, with the price firmly holding above the 20-day, 50-day, 100-day, and 200-day moving averages. The short-term 20-day moving average (100.13) provides strong dynamic support, and all moving averages are diverging upwards in sync, indicating a solid upward trend structure.
The MACD indicator DIFF (0.6006) continues to run above DEA (0.4476), and the red momentum bars continue to expand, indicating sufficient bullish momentum. There are currently no signs of a top divergence or reversal.
The RSI indicator rose to 73.48, approaching the 80 overbought threshold. There is a short-term need for a technical pullback to correct the indicator, but this does not undermine the medium- to long-term upward trend.
The overall market is dominated by bulls, and the short-term RSI is approaching the overbought zone, indicating a slight pullback is likely. Buying on dips to the short-term moving average support level is a good opportunity. A breakout above 101.80 with increased volume would open up further upside potential. Only a decisive break below the 20-day moving average would reverse the bullish trend in the short term.
(US Dollar Index Daily Chart, Source: FX678)
At 13:47 Beijing time on June 25, the US dollar index was at 105.54.
- Risk Warning and Disclaimer
- The market involves risk, and trading may not be suitable for all investors. This article is for reference only and does not constitute personal investment advice, nor does it take into account certain users’ specific investment objectives, financial situation, or other needs. Any investment decisions made based on this information are at your own risk.