Gold prices rallied before retreating, retesting key support levels, and are expected to remain range-bound in the short term.
2026-07-07 13:17:59
Spot gold (XAU/USD) continued its downward trend in Asian trading on Tuesday, falling for the second consecutive session and briefly retreating to the $4125-$4124 range. The gold market has recently been influenced by both bullish and bearish factors. On the one hand, rising risks in the energy market have fueled inflation concerns, pushing up US Treasury yields and putting downward pressure on gold. On the other hand, a shift in expectations regarding Federal Reserve policy and a weakening dollar have limited further downside for gold.

The situation in the Strait of Hormuz has recently become a focus of market attention again. As this region is a vital global energy transport route, any supply risks could impact international oil prices. Market research indicates that an oil tanker was attacked by an unidentified object while transiting the Strait of Hormuz, further complicating the already fragile US-Iran ceasefire agreement.
Meanwhile, Iran is attempting to strengthen its strategic control over the waters and has proposed charging vessels transiting the strait a fee. Iran states that the fee will primarily be used for security management, vessel supervision, and environmental protection, rather than a traditional toll. However, this move has drawn external opposition and further increased market concerns about the stability of energy supplies.
Supported by rising crude oil prices, the market is once again focusing on inflation risks, leading to a rise in US Treasury yields. As an asset that does not generate interest income, gold faces pressure from capital outflows in an environment of rising real yields, which has become a significant factor in the recent pullback in gold prices.
However, gold bears have not gained a decisive advantage. Recent US non-farm payroll data showed that June job growth fell short of market expectations, prompting investors to reduce their bets on future Federal Reserve rate hikes. The market had previously anticipated one or even two rate hikes in 2026, but current expectations have been adjusted to between zero and one. This change weakened the confidence of dollar bulls and reduced investors' willingness to significantly short gold. Regarding US economic data, the June ISM Services Purchasing Managers' Index (PMI) fell to 54.0 from 54.5 in May, in line with market expectations, but did not significantly strengthen the dollar's upward momentum.
The market remains in a wait-and-see phase, with investors hoping to find direction from the latest policy signals from the Federal Reserve. Market focus will shift to the upcoming release of the Fed meeting minutes to determine future interest rate paths. Meanwhile, geopolitical developments could continue to influence demand for the US dollar as a safe haven, further impacting gold price movements.
From a fundamental perspective, the upward momentum of gold after its recent rebound from its year-to-date lows is weakening, but the market has not yet confirmed that the rebound has ended. Given the lack of sustained upward momentum in the US dollar and the expectation of a shift towards easing by the Federal Reserve, gold still faces some support. Therefore, investors need to wait for clearer selling signals to confirm that gold prices have entered a new downward trend.
From a daily chart perspective, gold prices are currently still trading within a downtrend, with an overall short-term weak trend. The price remains below the 200-day simple moving average of $4489 , indicating continued medium-term pressure. However, the MACD indicator has recently shown improvement, with the fast line returning above the slow line and the red histogram bars gradually expanding, suggesting a recovery in short-term rebound momentum. At the same time, the RSI indicator is currently around 44.16, still below the neutral level of 50, indicating that market sentiment remains cautious and gold has not yet fully escaped its weak position.
Currently, the first support level to watch for gold is around $4100 , which could become a key battleground between bulls and bears in the short term. A break below this level could see prices further test the important support area around $3844, near the lower edge of the descending channel. On the upside, the first resistance level to watch for a short-term rebound is around $4296 , near the upper trendline of the descending channel. A break above this level could lead to a further challenge of the 200-day moving average around $4489, followed by higher structural resistance around $4572.
From a 4-hour chart perspective, gold has recently maintained a volatile downward trend, gradually adjusting downwards after breaking below $4200, with short-term moving averages leaning bearish. However, with the MACD momentum showing some recovery, a technical rebound is possible. If gold prices can regain a foothold in the $4150-$4160 area, short-term buying may increase, pushing prices to test the resistance near $4200; if the rebound fails and falls below $4100, it could open up further downside potential. Currently, the market still needs to pay attention to the impact of the Fed meeting minutes and changes in geopolitical risks on safe-haven fund flows.
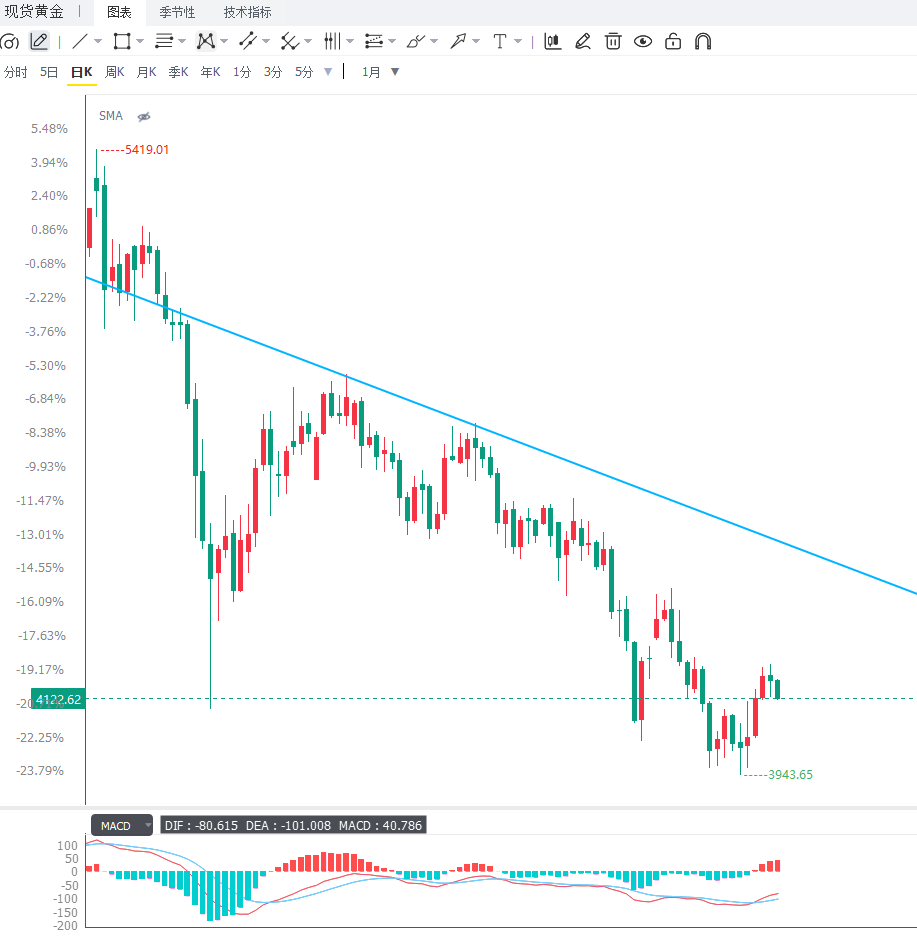
Editor's Summary : Gold's recent price action has been influenced by both inflation risks and monetary policy expectations. Tensions in the Strait of Hormuz have driven up oil prices and yields, putting short-term pressure on gold. However, a cooling US job market has reduced expectations of a Fed rate hike, limiting the dollar's rise and providing some support for gold. Currently, the market has not formed a clear one-sided trend, and gold remains in a post-rebound adjustment phase. Future price movements will depend on Fed policy signals, the direction of the dollar, and changes in global risk events. If real interest rates continue to rise, gold may further test the $4100 support level; however, if expectations of rate cuts strengthen or safe-haven demand resurfaces, gold still has a chance to regain upward momentum. In the short term, the $4100 to $4300 range will be a crucial area for gold's next directional move, and investors need to closely monitor breakouts to determine subsequent trends.
The situation in the Strait of Hormuz has recently become a focus of market attention again. As this region is a vital global energy transport route, any supply risks could impact international oil prices. Market research indicates that an oil tanker was attacked by an unidentified object while transiting the Strait of Hormuz, further complicating the already fragile US-Iran ceasefire agreement.
Meanwhile, Iran is attempting to strengthen its strategic control over the waters and has proposed charging vessels transiting the strait a fee. Iran states that the fee will primarily be used for security management, vessel supervision, and environmental protection, rather than a traditional toll. However, this move has drawn external opposition and further increased market concerns about the stability of energy supplies.
Supported by rising crude oil prices, the market is once again focusing on inflation risks, leading to a rise in US Treasury yields. As an asset that does not generate interest income, gold faces pressure from capital outflows in an environment of rising real yields, which has become a significant factor in the recent pullback in gold prices.
However, gold bears have not gained a decisive advantage. Recent US non-farm payroll data showed that June job growth fell short of market expectations, prompting investors to reduce their bets on future Federal Reserve rate hikes. The market had previously anticipated one or even two rate hikes in 2026, but current expectations have been adjusted to between zero and one. This change weakened the confidence of dollar bulls and reduced investors' willingness to significantly short gold. Regarding US economic data, the June ISM Services Purchasing Managers' Index (PMI) fell to 54.0 from 54.5 in May, in line with market expectations, but did not significantly strengthen the dollar's upward momentum.
The market remains in a wait-and-see phase, with investors hoping to find direction from the latest policy signals from the Federal Reserve. Market focus will shift to the upcoming release of the Fed meeting minutes to determine future interest rate paths. Meanwhile, geopolitical developments could continue to influence demand for the US dollar as a safe haven, further impacting gold price movements.
From a fundamental perspective, the upward momentum of gold after its recent rebound from its year-to-date lows is weakening, but the market has not yet confirmed that the rebound has ended. Given the lack of sustained upward momentum in the US dollar and the expectation of a shift towards easing by the Federal Reserve, gold still faces some support. Therefore, investors need to wait for clearer selling signals to confirm that gold prices have entered a new downward trend.
From a daily chart perspective, gold prices are currently still trading within a downtrend, with an overall short-term weak trend. The price remains below the 200-day simple moving average of $4489 , indicating continued medium-term pressure. However, the MACD indicator has recently shown improvement, with the fast line returning above the slow line and the red histogram bars gradually expanding, suggesting a recovery in short-term rebound momentum. At the same time, the RSI indicator is currently around 44.16, still below the neutral level of 50, indicating that market sentiment remains cautious and gold has not yet fully escaped its weak position.
Currently, the first support level to watch for gold is around $4100 , which could become a key battleground between bulls and bears in the short term. A break below this level could see prices further test the important support area around $3844, near the lower edge of the descending channel. On the upside, the first resistance level to watch for a short-term rebound is around $4296 , near the upper trendline of the descending channel. A break above this level could lead to a further challenge of the 200-day moving average around $4489, followed by higher structural resistance around $4572.
From a 4-hour chart perspective, gold has recently maintained a volatile downward trend, gradually adjusting downwards after breaking below $4200, with short-term moving averages leaning bearish. However, with the MACD momentum showing some recovery, a technical rebound is possible. If gold prices can regain a foothold in the $4150-$4160 area, short-term buying may increase, pushing prices to test the resistance near $4200; if the rebound fails and falls below $4100, it could open up further downside potential. Currently, the market still needs to pay attention to the impact of the Fed meeting minutes and changes in geopolitical risks on safe-haven fund flows.
Editor's Summary : Gold's recent price action has been influenced by both inflation risks and monetary policy expectations. Tensions in the Strait of Hormuz have driven up oil prices and yields, putting short-term pressure on gold. However, a cooling US job market has reduced expectations of a Fed rate hike, limiting the dollar's rise and providing some support for gold. Currently, the market has not formed a clear one-sided trend, and gold remains in a post-rebound adjustment phase. Future price movements will depend on Fed policy signals, the direction of the dollar, and changes in global risk events. If real interest rates continue to rise, gold may further test the $4100 support level; however, if expectations of rate cuts strengthen or safe-haven demand resurfaces, gold still has a chance to regain upward momentum. In the short term, the $4100 to $4300 range will be a crucial area for gold's next directional move, and investors need to closely monitor breakouts to determine subsequent trends.
- Risk Warning and Disclaimer
- The market involves risk, and trading may not be suitable for all investors. This article is for reference only and does not constitute personal investment advice, nor does it take into account certain users’ specific investment objectives, financial situation, or other needs. Any investment decisions made based on this information are at your own risk.