Spot gold's direction is unclear around $4,000.
2026-07-16 01:00:11
Although gold has risen nearly 1.5% in the past two trading days, this rally is not yet sufficient to establish a strong bullish trend. Following the release of the US Producer Price Index (PPI) inflation data, gold buying momentum failed to fully recover, and the overall trend is currently neutral.  Gold has risen nearly 1.5% in the past two trading days, but this increase is not enough to form an overwhelming bullish trend. Following the release of the US PPI inflation data, buying momentum in gold has been slow to fully recover, and the current price trend is generally neutral. This is partly due to the fact that although inflationary pressures are showing signs of easing, the US Treasury market remains strong and continues to be a powerful alternative investment to gold. This situation will likely keep spot gold in a state of indecision in the short term. US PPI Data Released The US core PPI (Producer Price Index) was released during this trading session, an indicator used to measure potential inflationary pressures. The data fell short of expectations: the monthly rate was 0.2%, while the market expectation was 0.3%. Overall, the US Producer Price Index has been declining since May, moving away from the high of 0.7% in April. Combined with the Consumer Price Index (CPI) released the previous trading day, both sets of data confirm that US inflationary pressures have eased to some extent. After two consecutive days of inflation data releases, market expectations for aggressive interest rate hikes by the Federal Reserve have shifted significantly. Interest rate futures probability data shows that the probability of the Fed maintaining the current interest rate at the September 16th FOMC meeting is 49.1%; the probability of the Fed raising interest rates by 25 basis points to 4.00% has decreased to 45.5%. In other words, influenced by the latest inflation data, the market believes that the possibility of the Fed aggressively tightening monetary policy is lower than previously anticipated. However, the most crucial factor affecting gold prices remains the US 10-year Treasury bond market, with US Treasuries considered the most important alternative asset to gold. Although the market expected a weaker pace of Fed rate hikes compared to a few weeks ago, US Treasury yields did not fall significantly after the inflation data release; while yields have declined slightly recently, the drop has been limited, and yields remain above 4.5%. The difference in their characteristics makes this situation unfavorable for gold price increases: bonds generate interest income, while gold itself does not. When short-term US Treasury yields remain high and stable, gold's attractiveness is greatly reduced. High US Treasury yields prompt funds to flow out of the gold market and into alternative assets like US Treasuries. The fund flows of SPDR Gold Shares, the largest gold ETF, confirm this: the ETF has seen no net inflows over the past month; the latest data from July 10th shows an outflow of over $350 million. The sharp rise in US Treasury yields over the past month, coupled with the continued outflow of funds from gold ETFs, clearly demonstrates that gold's attractiveness has declined compared to the bond market. In summary, the strengthening of alternative assets is a major reason limiting a significant rebound in gold buying; if this situation continues, it will be difficult for gold to see sustained strong buying, and gold prices are likely to continue to fluctuate in a directional manner. Technical Analysis
 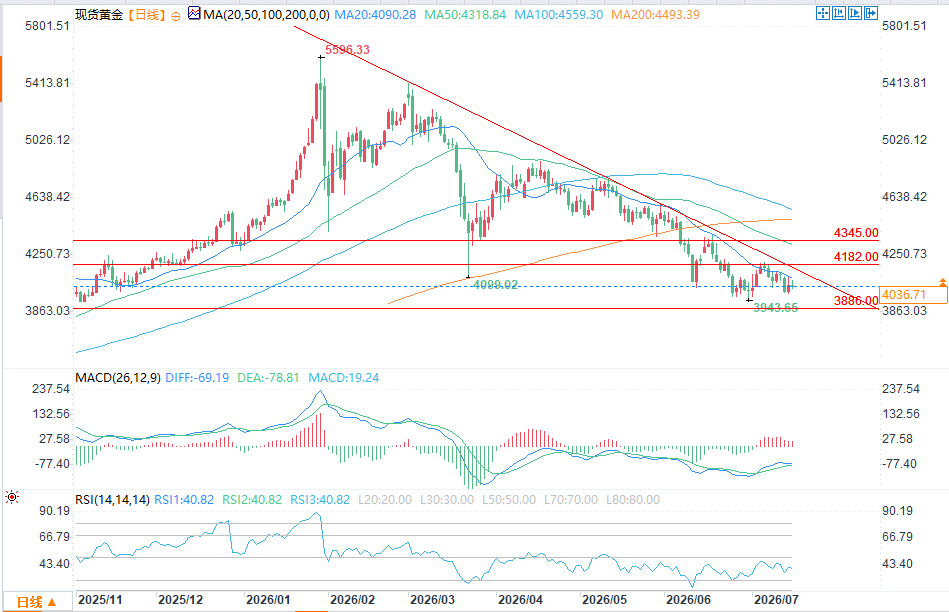 (Spot Gold Daily Chart Source: EasyTrade) The Downtrend Line Remains Key: Although gold prices have attempted to rebound several times recently, the upward momentum is insufficient compared to the daily downtrend structure established since early March 2026. This downtrend line remains the primary technical level to watch; however, if gold prices do not make new lows, a neutral consolidation pattern may weaken the bearish trend, and gold prices are likely to enter a sideways trading range. Relative Strength Index (RSI): The RSI indicator is near the 50 neutral line, indicating that the bullish and bearish forces have been relatively balanced over the past 14 trading days, leaving the market in a dilemma; if the indicator maintains its current state, the gold price consolidation pattern will continue. Moving Average Convergence Divergence (MACD): The MACD histogram is close to the zero line, and the short-term moving averages are evenly matched, further confirming that gold prices are likely to enter a consolidation phase. Key Level to Watch: $4345: A key resistance level. This level is the high of recent weeks and coincides with the 50-period simple moving average and the 23.6% Fibonacci retracement level of this significant downtrend. If gold prices rise to this level, the daily downtrend will be challenged, and a strong bullish trend may only emerge in the coming weeks. $4182: A short-term key level. This corresponds to a recent important retracement level. If gold prices linger around this level for an extended period, the consolidation will be further solidified, and gold prices are likely to trade within a narrow range in the short term. $3886: A core support level, corresponding to the October 2025 low, and the next important target for bears. Once gold prices fall back to this level, the downtrend will regain control, and the decline will continue.
Gold has risen nearly 1.5% in the past two trading days, but this increase is not enough to form an overwhelming bullish trend. Following the release of the US PPI inflation data, buying momentum in gold has been slow to fully recover, and the current price trend is generally neutral. This is partly due to the fact that although inflationary pressures are showing signs of easing, the US Treasury market remains strong and continues to be a powerful alternative investment to gold. This situation will likely keep spot gold in a state of indecision in the short term. US PPI Data Released The US core PPI (Producer Price Index) was released during this trading session, an indicator used to measure potential inflationary pressures. The data fell short of expectations: the monthly rate was 0.2%, while the market expectation was 0.3%. Overall, the US Producer Price Index has been declining since May, moving away from the high of 0.7% in April. Combined with the Consumer Price Index (CPI) released the previous trading day, both sets of data confirm that US inflationary pressures have eased to some extent. After two consecutive days of inflation data releases, market expectations for aggressive interest rate hikes by the Federal Reserve have shifted significantly. Interest rate futures probability data shows that the probability of the Fed maintaining the current interest rate at the September 16th FOMC meeting is 49.1%; the probability of the Fed raising interest rates by 25 basis points to 4.00% has decreased to 45.5%. In other words, influenced by the latest inflation data, the market believes that the possibility of the Fed aggressively tightening monetary policy is lower than previously anticipated. However, the most crucial factor affecting gold prices remains the US 10-year Treasury bond market, with US Treasuries considered the most important alternative asset to gold. Although the market expected a weaker pace of Fed rate hikes compared to a few weeks ago, US Treasury yields did not fall significantly after the inflation data release; while yields have declined slightly recently, the drop has been limited, and yields remain above 4.5%. The difference in their characteristics makes this situation unfavorable for gold price increases: bonds generate interest income, while gold itself does not. When short-term US Treasury yields remain high and stable, gold's attractiveness is greatly reduced. High US Treasury yields prompt funds to flow out of the gold market and into alternative assets like US Treasuries. The fund flows of SPDR Gold Shares, the largest gold ETF, confirm this: the ETF has seen no net inflows over the past month; the latest data from July 10th shows an outflow of over $350 million. The sharp rise in US Treasury yields over the past month, coupled with the continued outflow of funds from gold ETFs, clearly demonstrates that gold's attractiveness has declined compared to the bond market. In summary, the strengthening of alternative assets is a major reason limiting a significant rebound in gold buying; if this situation continues, it will be difficult for gold to see sustained strong buying, and gold prices are likely to continue to fluctuate in a directional manner. Technical Analysis (Spot Gold Daily Chart Source: EasyTrade) The Downtrend Line Remains Key: Although gold prices have attempted to rebound several times recently, the upward momentum is insufficient compared to the daily downtrend structure established since early March 2026. This downtrend line remains the primary technical level to watch; however, if gold prices do not make new lows, a neutral consolidation pattern may weaken the bearish trend, and gold prices are likely to enter a sideways trading range. Relative Strength Index (RSI): The RSI indicator is near the 50 neutral line, indicating that the bullish and bearish forces have been relatively balanced over the past 14 trading days, leaving the market in a dilemma; if the indicator maintains its current state, the gold price consolidation pattern will continue. Moving Average Convergence Divergence (MACD): The MACD histogram is close to the zero line, and the short-term moving averages are evenly matched, further confirming that gold prices are likely to enter a consolidation phase. Key Level to Watch: $4345: A key resistance level. This level is the high of recent weeks and coincides with the 50-period simple moving average and the 23.6% Fibonacci retracement level of this significant downtrend. If gold prices rise to this level, the daily downtrend will be challenged, and a strong bullish trend may only emerge in the coming weeks. $4182: A short-term key level. This corresponds to a recent important retracement level. If gold prices linger around this level for an extended period, the consolidation will be further solidified, and gold prices are likely to trade within a narrow range in the short term. $3886: A core support level, corresponding to the October 2025 low, and the next important target for bears. Once gold prices fall back to this level, the downtrend will regain control, and the decline will continue.
- Risk Warning and Disclaimer
- The market involves risk, and trading may not be suitable for all investors. This article is for reference only and does not constitute personal investment advice, nor does it take into account certain users’ specific investment objectives, financial situation, or other needs. Any investment decisions made based on this information are at your own risk.