The ceasefire agreement is in jeopardy, and concerns about supply disruptions are pushing up oil prices.
2026-05-12 19:32:04
On Tuesday (May 12) during the European trading session, West Texas Intermediate (WTI) crude oil futures prices on the New York Mercantile Exchange surged by approximately 2.6%-3.6%, approaching or exceeding the $98-$101 per barrel range; Brent crude oil futures also strengthened, rising by more than 3% to around $107 per barrel. Both benchmark oil prices have risen for several consecutive days, with significant cumulative gains, primarily driven by escalating tensions between the US and Iran and the potential long-term closure of the Strait of Hormuz.
Geopolitical risks: The US-Iran ceasefire agreement is in jeopardy
US President Trump stated on Monday that Iran's response was "utterly stupid" and "unacceptable," saying the ceasefire agreement was "hanging by a thread" or "in a state of mass life support," with a very low chance of survival. The two sides have serious disagreements on core demands such as a complete cessation of hostilities, lifting the naval blockade, resuming Iranian oil exports, and war reparations. Iran, on the other hand, reiterated its sovereignty over the Strait of Hormuz and demanded compensation for war losses.
The Strait of Hormuz is a vital waterway for approximately 20% of the world's crude oil and liquefied natural gas transport. The potential for a long-term closure or blockade directly drives up market risk premiums. Saudi Aramco CEO Amin Nasser warned that if exports are disrupted, market stabilization could be delayed until 2027, with weekly oil losses potentially reaching 100 million barrels. OPEC's crude oil production in April fell to its lowest level in over two decades, and exports from some oil-producing countries have been hampered.
Tim Wouter of KCMTrade stated that if a substantial breakthrough is achieved in peace negotiations, oil prices could rebound by $8-12; however, if the situation escalates or the threat of a blockade reappears, Brent crude will quickly rise back above $115. Carsten Fritz of Commerzbank also pointed out that tensions have escalated again after both sides rejected each other's proposals.
Supply side: Short-term tightening expected, US inventories likely to decline
A survey indicates that U.S. crude oil inventories are expected to have decreased by approximately 1.7 million barrels last week, which will provide support for oil prices. Walter Chancellor, energy strategist at Macquarie Group, believes that seaborne exports of crude oil and refined products are likely to remain strong in the coming weeks.
Despite long-standing concerns about oversupply (the IEA has predicted a significant surplus in the global oil market by 2026), current geopolitical factors have overshadowed signals of easing fundamentals. OPEC+ production constraints have further tightened available supply.
Demand Side: Chinese Factors and Macroeconomic Data
Chinese independent refineries are reportedly cutting fuel oil production due to shrinking profit margins caused by weak domestic demand and an oversupply of refined oil products. Tariffs imposed during the US-China trade friction have essentially halted China's imports of US crude oil and LNG (estimated at $8.4 billion in imports in 2024). Investors are also watching the upcoming meeting between Trump and the Chinese president, the outcome of which could influence energy trade policy.
The US April Consumer Price Index (CPI) will be released today (May 12) at 8:30 PM Beijing time. The market expects the overall inflation rate to rise to 3.7% from 3.3% in March, which will provide clues about the Federal Reserve's interest rate path and indirectly affect expectations for oil demand.
Overall judgment
In the short term, geopolitical risk premiums are dominating oil price movements, with supply disruption concerns supporting high prices. WTI and Brent crude have risen by over 40% since conflict-related events began this year. However, if negotiations unexpectedly progress or US inventory data falls short of expectations, oil prices face downward pressure. In the medium to long term, attention should still be paid to global demand recovery, Chinese inventory replenishment, and OPEC+ developments.
Technical Analysis
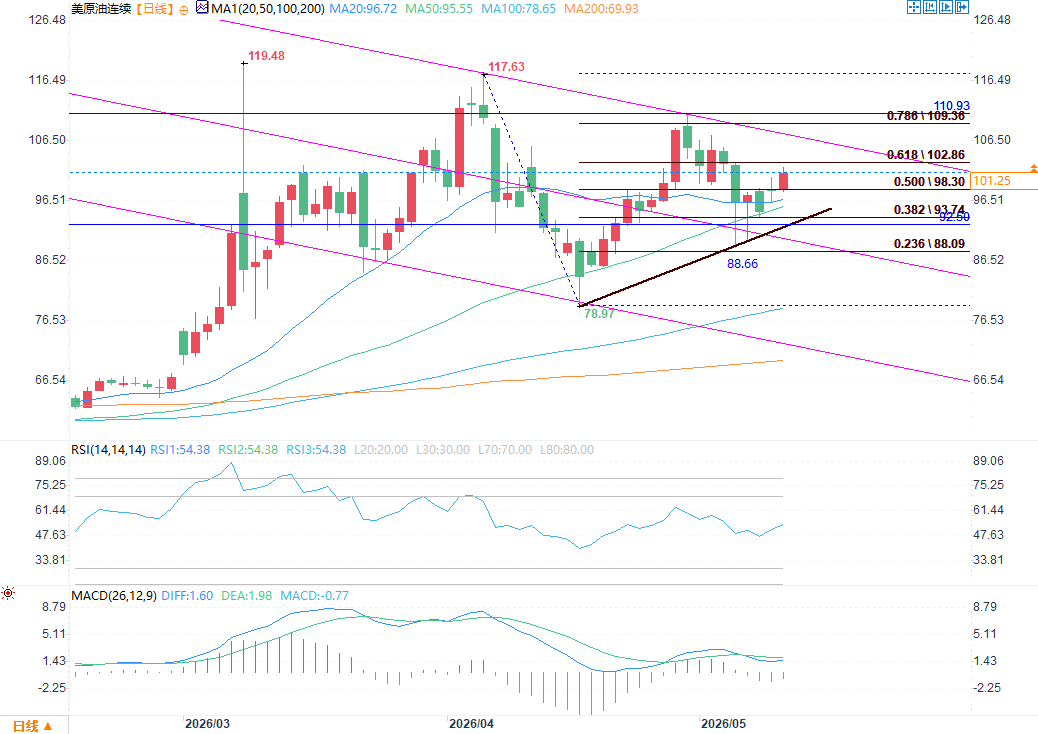
(WTI crude oil daily chart source: FX678)
On the daily chart, US crude oil is currently trading within a gently sloping descending channel formed by continuously declining highs and lows. This channel is clearly defined by the pink trend line in the chart, and the characteristic of gradually declining highs is evident, indicating that the overall medium-term trend is weak. The current price is still in a consolidation phase near the middle line of the channel, and no effective trend breakout signal has yet formed.
Currently, oil prices are trading above the 0.5 Fibonacci retracement level (98.3) of the 117.63-78.97 downward wave. Prices have consistently remained above this midline recently, with multiple pullbacks failing to break below it, indicating that bullish momentum still dominates in the short term, forming a phase of slightly bullish consolidation. If prices continue to rise, the first target will be the 0.618 level at 102.86. This level is both a key Fibonacci resistance and coincides with the upper edge of the recent trading range, making it the core target for a short-term rebound. Above this, the next resistance level is the 0.786 level at 109.36, forming a complex resistance zone with the previous high of 110.93. This resistance is quite strong and is a crucial dividing line for whether the medium-term rebound can continue.
If the price breaks through this resistance zone, the theoretical next targets are the previous highs of 117.63 and 119.48. However, judging from the current channel structure with continuously declining highs and the arrangement of the moving average system, the bullish momentum is insufficient to support the price to break through the upper rail of the descending channel. The probability of breaking through the historical high is not high, and it is more likely to encounter resistance and fall back in the range of 102.86-109.36.
On the support side, the first key support level is the 0.5 Fibonacci retracement level at 98.3, which is the lower edge of the current trading range and a key dividing line between short-term bullish and bearish strength. Within the 0.382-0.5 range (93.74-98.30), there are two important moving averages, the MA20 and MA60, as well as the black upward trend line in the chart, forming a multi-support resonance area of "Fibonacci level + moving average + trend line," indicating strong technical support. If the price retraces, it is highly likely to find support and stabilize within this range. If the price breaks below this support level with significant volume, it will test the 0.236 level at 88.09, which highly coincides with the previous low of 88.66, forming a double support of Fibonacci level and previous low, a key defensive line for medium-term bulls and bears. If the price breaks below 88.09, it means that the short-term upward trend has been broken, the medium-term trend will likely weaken, and the long-term trend will need to test the support of the lower rail of the descending channel and the 100/200-day moving average. This is also a key verification level for judging whether the trend has completely reversed.
From the perspective of auxiliary indicators, the current RSI indicator is in the neutral to strong range of 54.47, and has not entered the overbought zone, indicating that the bullish momentum has not been over-exhausted, and the price still has room for a slight upward movement. The MACD indicator's DIFF line and DEA line are still running above the zero axis, and although the histogram is negative, it continues to narrow, indicating that the bearish momentum is weakening. Overall, it is still in a consolidation phase where the bulls are in control, and no clear reversal signal has been issued.
Geopolitical risks: The US-Iran ceasefire agreement is in jeopardy
US President Trump stated on Monday that Iran's response was "utterly stupid" and "unacceptable," saying the ceasefire agreement was "hanging by a thread" or "in a state of mass life support," with a very low chance of survival. The two sides have serious disagreements on core demands such as a complete cessation of hostilities, lifting the naval blockade, resuming Iranian oil exports, and war reparations. Iran, on the other hand, reiterated its sovereignty over the Strait of Hormuz and demanded compensation for war losses.
The Strait of Hormuz is a vital waterway for approximately 20% of the world's crude oil and liquefied natural gas transport. The potential for a long-term closure or blockade directly drives up market risk premiums. Saudi Aramco CEO Amin Nasser warned that if exports are disrupted, market stabilization could be delayed until 2027, with weekly oil losses potentially reaching 100 million barrels. OPEC's crude oil production in April fell to its lowest level in over two decades, and exports from some oil-producing countries have been hampered.
Tim Wouter of KCMTrade stated that if a substantial breakthrough is achieved in peace negotiations, oil prices could rebound by $8-12; however, if the situation escalates or the threat of a blockade reappears, Brent crude will quickly rise back above $115. Carsten Fritz of Commerzbank also pointed out that tensions have escalated again after both sides rejected each other's proposals.
Supply side: Short-term tightening expected, US inventories likely to decline
A survey indicates that U.S. crude oil inventories are expected to have decreased by approximately 1.7 million barrels last week, which will provide support for oil prices. Walter Chancellor, energy strategist at Macquarie Group, believes that seaborne exports of crude oil and refined products are likely to remain strong in the coming weeks.
Despite long-standing concerns about oversupply (the IEA has predicted a significant surplus in the global oil market by 2026), current geopolitical factors have overshadowed signals of easing fundamentals. OPEC+ production constraints have further tightened available supply.
Demand Side: Chinese Factors and Macroeconomic Data
Chinese independent refineries are reportedly cutting fuel oil production due to shrinking profit margins caused by weak domestic demand and an oversupply of refined oil products. Tariffs imposed during the US-China trade friction have essentially halted China's imports of US crude oil and LNG (estimated at $8.4 billion in imports in 2024). Investors are also watching the upcoming meeting between Trump and the Chinese president, the outcome of which could influence energy trade policy.
The US April Consumer Price Index (CPI) will be released today (May 12) at 8:30 PM Beijing time. The market expects the overall inflation rate to rise to 3.7% from 3.3% in March, which will provide clues about the Federal Reserve's interest rate path and indirectly affect expectations for oil demand.
Overall judgment
In the short term, geopolitical risk premiums are dominating oil price movements, with supply disruption concerns supporting high prices. WTI and Brent crude have risen by over 40% since conflict-related events began this year. However, if negotiations unexpectedly progress or US inventory data falls short of expectations, oil prices face downward pressure. In the medium to long term, attention should still be paid to global demand recovery, Chinese inventory replenishment, and OPEC+ developments.
Technical Analysis
(WTI crude oil daily chart source: FX678)
On the daily chart, US crude oil is currently trading within a gently sloping descending channel formed by continuously declining highs and lows. This channel is clearly defined by the pink trend line in the chart, and the characteristic of gradually declining highs is evident, indicating that the overall medium-term trend is weak. The current price is still in a consolidation phase near the middle line of the channel, and no effective trend breakout signal has yet formed.
Currently, oil prices are trading above the 0.5 Fibonacci retracement level (98.3) of the 117.63-78.97 downward wave. Prices have consistently remained above this midline recently, with multiple pullbacks failing to break below it, indicating that bullish momentum still dominates in the short term, forming a phase of slightly bullish consolidation. If prices continue to rise, the first target will be the 0.618 level at 102.86. This level is both a key Fibonacci resistance and coincides with the upper edge of the recent trading range, making it the core target for a short-term rebound. Above this, the next resistance level is the 0.786 level at 109.36, forming a complex resistance zone with the previous high of 110.93. This resistance is quite strong and is a crucial dividing line for whether the medium-term rebound can continue.
If the price breaks through this resistance zone, the theoretical next targets are the previous highs of 117.63 and 119.48. However, judging from the current channel structure with continuously declining highs and the arrangement of the moving average system, the bullish momentum is insufficient to support the price to break through the upper rail of the descending channel. The probability of breaking through the historical high is not high, and it is more likely to encounter resistance and fall back in the range of 102.86-109.36.
On the support side, the first key support level is the 0.5 Fibonacci retracement level at 98.3, which is the lower edge of the current trading range and a key dividing line between short-term bullish and bearish strength. Within the 0.382-0.5 range (93.74-98.30), there are two important moving averages, the MA20 and MA60, as well as the black upward trend line in the chart, forming a multi-support resonance area of "Fibonacci level + moving average + trend line," indicating strong technical support. If the price retraces, it is highly likely to find support and stabilize within this range. If the price breaks below this support level with significant volume, it will test the 0.236 level at 88.09, which highly coincides with the previous low of 88.66, forming a double support of Fibonacci level and previous low, a key defensive line for medium-term bulls and bears. If the price breaks below 88.09, it means that the short-term upward trend has been broken, the medium-term trend will likely weaken, and the long-term trend will need to test the support of the lower rail of the descending channel and the 100/200-day moving average. This is also a key verification level for judging whether the trend has completely reversed.
From the perspective of auxiliary indicators, the current RSI indicator is in the neutral to strong range of 54.47, and has not entered the overbought zone, indicating that the bullish momentum has not been over-exhausted, and the price still has room for a slight upward movement. The MACD indicator's DIFF line and DEA line are still running above the zero axis, and although the histogram is negative, it continues to narrow, indicating that the bearish momentum is weakening. Overall, it is still in a consolidation phase where the bulls are in control, and no clear reversal signal has been issued.
- Risk Warning and Disclaimer
- The market involves risk, and trading may not be suitable for all investors. This article is for reference only and does not constitute personal investment advice, nor does it take into account certain users’ specific investment objectives, financial situation, or other needs. Any investment decisions made based on this information are at your own risk.